

Introduction
This year I set a personal goal of walking for a total of 1,000 kilometers and I’m proud to say I’m close to hitting that goal. I’ve been tracking all the different routes I take in an app named Strava. One nice feature of Strava is that the app provides access to the raw data in a format called GPX. Starva can visualize the route in their app, but I wanted to try and perform my own visualization. That brought me to this blog post about using Leaflet JS to plot one of my walks on a map.
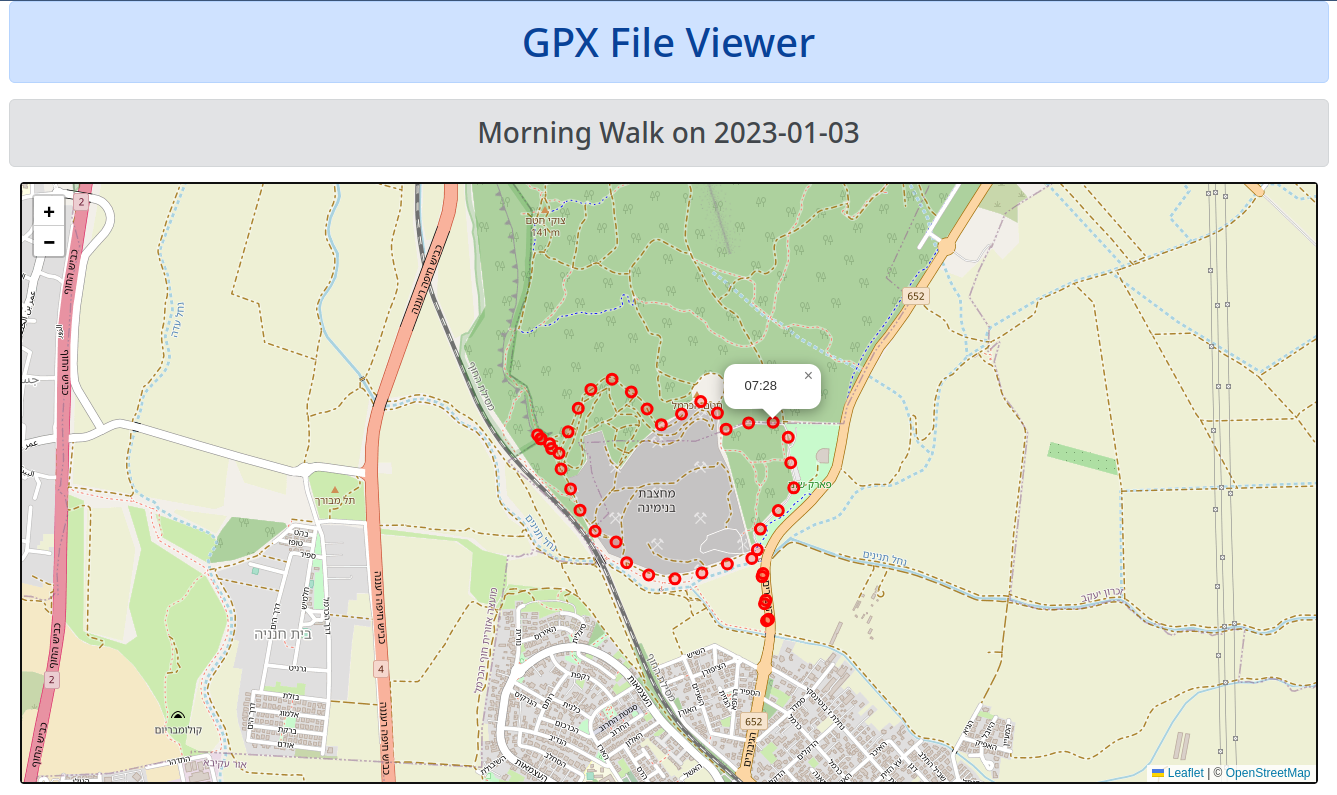
In this post, we’re going to write a Go service that accepts a GPX file and returns an interactive map that a browser can render showing the points recorded in the GPX file.
The application will look like:
Raw Data
Let’s start by reviewing the data that is recorded in the GPX file.
Listing 1: Morning_Walk.gpx
<?xml version="1.0" encoding="UTF-8"?>
<gpx creator="StravaGPX Android" xmlns:xsi="http://www.w3.org/2001/XMLSchema-instance" xsi:schemaLocation="http://www.topografix.com/GPX/1/1 http://www.topografix.com/GPX/1/1/gpx.xsd" version="1.1" xmlns="http://www.topografix.com/GPX/1/1">
    <metadata>
        <time>2023-01-03T06:50:42Z</time>
    </metadata>
    <t1rk>
        <name>Morning Walk</name>
        <type>walking</type>
        <trkseg>
            <trkpt lat="32.5254730" lon="34.9429370">
                <ele>19.5</ele>
                <time>2023-01-03T06:50:42Z</time>
            </trkpt>
            <trkpt lat="32.5254790" lon="34.9429480">
                 <ele>19.5</ele>
                 <time>2023-01-03T06:50:43Z</time>
            </trkpt>
            ...
        </trkseg>
    </trk>
</gpx>
Listing 1 shows a truncated version of a GPX file for one of my morning walks. You can see its XML formatted data and the location data is in the `trkpt/trkseq`` element.
Let’s run a quick query using grep to see how many trkpt tags there are in the data file:
Listing 2: Number of Points
$ grep '<trkpt' Morning_Walk.gpx | wc -l
2600
In listing 2, you can see there’s 2,600 location points which is a lot to display. Since many of these points are basically on top of each other, plotting all of them won’t give us much value. One thing we can do to reduce the number of points we display by aggregating the points by a time frequency. In this case, I will aggregate the points by a minute.
Note: Parsing XML with grep is not the best option though for my use case it worked fine. There are better tools such as XMLStarlet
Parsing GPX
To start, we can parse the GPX data file using the built-in encoing/xml package from the Go standard library.
Listing 3: Parsing GPX
09 // Point is a point in GPX data.
10 type Point struct {
11     Lat  float64
12     Lng  float64
13     Time time.Time
14 }
15
16 // GPX is data in a GPX file.
17 type GPX struct {
18     Name   string
19     Time   time.Time
20     Points []Point
21 }
22
23 // ParseGPX parses a GPX file, returns GPX.
24 func ParseGPX(r io.Reader) (GPX, error) {
25     var xmlData struct {
26         Time time.Time `xml:"metadata>time"`
27         Trk  struct {
28             Name   string `xml:"name"`
29             Points []struct {
30                 Lat  float64   `xml:"lat,attr"`
31                 Lon  float64   `xml:"lon,attr"`
32                 Time time.Time `xml:"time"`
33             } `xml:"trkseg>trkpt"`
34         } `xml:"trk"`
35     }
36
37     dec := xml.NewDecoder(r)
38     if err := dec.Decode(&xmlData); err != nil {
39         return GPX{}, err
40     }
41
42     gpx := GPX{
43         Name:   xmlData.Trk.Name,
44         Time:   xmlData.Time,
45         Points: make([]Point, len(xmlData.Trk.Points)),
46     }
47
48     for i, pt := range xmlData.Trk.Points {
49         gpx.Points[i].Lat = pt.Lat
50         gpx.Points[i].Lng = pt.Lon
51         gpx.Points[i].Time = pt.Time
52     }
53
54     return gpx, nil
55 }
Listing 3 shows how to parse a GPX data file using the Go standard library. On lines 10 and 17, I define the Point and GPX structs. They are the types returned from parsing. As a general rule, don’t export data structures that will require special tags to unmarshal internal data (e.g. the one in the XML). Define clean data structures for the API and protect the API from uncontrolled change.
For example, GPX calls longitude lon while leaflet uses lng.
One other interesting design choice is on line 25 inside the ParseGPX function. Here I define a literal struct with the appropriate tags to unmarshal the GPX data. There is no need to model the whole structure of the XML, only the elements we need. Then on line 48, that data is marshaled into the final struct value for the API.
Data Aggregation
Since there are too many points to display on the map, we decided to aggregate the points by every minute.
This is similar to SQL GROUP BY where you first group rows to buckets depending on a key (the time rounded to a minute in our case) and then run an aggregation on the values in each bucket (mean in our case). The SQL code (for SQLite3) can be something like:
SELECT
    strftime('%H:%M', time),
    AVG(lat),
    AVG(lng)
FROM points
    GROUP BY strftime('%H:%M', time);
We need to do the same in Go code, so the following code can perform that aggregation.
Listing 4: Aggregation
57 // roundToMinute rounds time to minute granularity.
58 func roundToMinute(t time.Time) time.Time {
59     year, month, day := t.Year(), t.Month(), t.Day()
60     hour, minute := t.Hour(), t.Minute()
61
62     return time.Date(year, month, day, hour, minute, 0, 0, t.Location())
63 }
64
65 // meanByMinute aggregates points by the minute.
66 func meanByMinute(points []Point) []Point {
67     // Aggregate columns
68     lats := make(map[time.Time][]float64)
69     lngs := make(map[time.Time][]float64)
70
71     // Group by minute
72     for _, pt := range points {
73         key := roundToMinute(pt.Time)
74         lats[key] = append(lats[key], pt.Lat)
75         lngs[key] = append(lngs[key], pt.Lng)
76     }
77
78     // Average per minute
79     avgs := make([]Point, len(lngs))
80     i := 0
81     for time, lats := range lats {
82         avgs[i].Time = time
83         avgs[i].Lat = mean(lats)
84         avgs[i].Lng = mean(lngs[time])
85         i++
86     }
87
88     return avgs
89 }
Listing 4 shows the code needed to aggregate the points by a minute. The function to call is meanByMinute which uses the roundToMinute function.
Map HTML Template & JavaScript
We are going to use the html/template package to render the map. Most of the HTML is static, but we will generate the title, data, and the points dynamically.
Listing 5: Map HTML Template
01 <!doctype html>
02 <html>
03   <head>
04     <link rel="stylesheet" href="https://cdn.jsdelivr.net/npm/bootstrap@5.2.3/dist/css/bootstrap.min.css"
05       integrity="sha384-rbsA2VBKQhggwzxH7pPCaAqO46MgnOM80zW1RWuH61DGLwZJEdK2Kadq2F9CUG65"
06       crossorigin="anonymous">
07     <meta name="viewport" content="width=device-width, initial-scale=1">
08     <link rel="stylesheet" href="https://unpkg.com/leaflet@1.9.4/dist/leaflet.css"
09       integrity="sha256-p4NxAoJBhIIN+hmNHrzRCf9tD/miZyoHS5obTRR9BMY="
10       crossorigin=""/>
11     <script src="https://unpkg.com/leaflet@1.9.4/dist/leaflet.js"
12      integrity="sha256-20nQCchB9co0qIjJZRGuk2/Z9VM+kNiyxNV1lvTlZBo="
13      crossorigin=""></script>
14   </head>
15   <body>
16     <div class="container">
17       <div class="row text-center">
18     <h1 class="alert alert-primary" role="alert">GPX File Viewer</h1>
19     <h3 class="alert alert-secondary" role="alert">{{ .Name }} on {{ .Date }}</h1>
20       </div>
21       <div class="row">
22     <div class="col">
23       <div id="map" style="height: 600px; border: 1px solid black;"></div>
24     </div>
25       </div>
26     </div>
27     <script>
28       let points = [
29     {{- range $idx, $pt := .Points }}
30     {{ if $idx }},{{ end -}}
31     { "lat": {{ $pt.Lat }}, "lng": {{ $pt.Lng -}}, "time": {{ $pt.Time }} }
32     {{- end }}
33       ];
34       let center = [{{ .Center.Lat }}, {{ .Center.Lng }}];
35     </script>
36     <script src="/map.js"></script>
37   </body>
38 </html>
Listing 5 shows the HTML template file. This code may not be obvious so I will break it down.
On lines 04-13 we import bootstrap for the UI and also the leafletjs CSS and JS files. Then on line 19, we set the name and date of the GPX file. On lines 28-33, we generate a JavaScript array with the points from the input and line 34 sets the center variable. Finally on line 36, we import the map.js JavaScript code which will use points and center.
Next we need JavaScript that can perform the actual rendering of the points.
Listing 6: Map JavaScript
02 function on_loaded() {
03 // Create map & tiles.
04 var map = L.map('map').setView(center, 15);
05 L.tileLayer(
06 'https://tile.openstreetmap.org/{z}/{x}/{y}.png',
07 {
08 maxZoom: 19,
09 attribution: '© <a href="http://www.openstreetmap.org/copyright">OpenStreetMap</a>'
10 }
11 ).addTo(map);
12
13 // Add points with tooltip to map.
14 points.forEach((pt) => {
15 let circle = L.circle(
16 [pt.lat, pt.lng],
17 {
18 color: 'red',
19 radius: 20
20 }).addTo(map);
21 circle.bindPopup(pt.time);
22 });
23 }
24
25 document.addEventListener('DOMContentLoaded', on_loaded);
Listing 6 shows the JavaScript required to create the map. This code may not be obvious so I will break it down.
On line 04, we create the map with a center location and set the zoom level to 15. Then on lines 05-11, we load the tiles from OpenStreetMap and then on lines 14-23, we iterate over the points, adding them to the map as a red circle and setting the tooltip to be the hour.
Nothing will work without a handler function that can provide the HTML, CSS, and JavaScript for rendering in the browser.
Map HTTP Handler
Listing 7: Map HTTP Handler
61 // mapHandler gets GPX file via HTML form and return map from mapTemplate.
62 func (a *API) mapHandler(w http.ResponseWriter, r *http.Request) {
63     a.log.Info("map called", "remote", r.RemoteAddr)
64     if r.Method != http.MethodPost {
65         a.log.Error("bad method", "method", r.Method)
66         http.Error(w, "bad method", http.StatusMethodNotAllowed)
67         return
68     }
69
70     if err := r.ParseMultipartForm(1 << 20); err != nil {
71         a.log.Error("bad form", "error", err)
72         http.Error(w, "bad form", http.StatusBadRequest)
73         return
74     }
75
76     file, _, err := r.FormFile("gpx")
77     if err != nil {
78         a.log.Error("missing gpx file", "error", err)
79         http.Error(w, "missing gpx file", http.StatusBadRequest)
80         return
81     }
82
83     gpx, err := ParseGPX(file)
84     if err != nil {
85         a.log.Error("bad gpx", "error", err)
86         http.Error(w, "bad gpx", http.StatusBadRequest)
87         return
88     }
89
90     a.log.Info("gpx parsed", "name", gpx.Name, "count", len(gpx.Points))
91     meanPts := meanByMinute(gpx.Points)
92     a.log.Info("minute agg", "count", len(meanPts))
93
94     // Data for template
95     points := make([]map[string]any, len(meanPts))
96     for i, pt := range meanPts {
97         points[i] = map[string]any{
98             "Lat":  pt.Lat,
99             "Lng":  pt.Lng,
100             "Time": pt.Time.Format("15:04"), // HH:MM
101         }
102     }
103
104     clat, clng := center(gpx.Points)
105     data := map[string]any{
106         "Name":   gpx.Name,
107         "Date":   gpx.Time.Format(time.DateOnly),
108         "Center": map[string]float64{"Lat": clat, "Lng": clng},
109         "Points": points,
110     }
111
112     w.Header().Set("content-type", "text/html")
113     if err := mapTemplate.Execute(w, data); err != nil {
114         a.log.Error("can't execute template", "error", err)
115     }
116 }
Listing 7 shows the HTTP handler function. All this code brings together everything we did to provide the browser what it needs to visualize the trail.
Finally we need to write some code to start the service to handle a HTTP request to render the map.
Starting The Server
Listing 8: HTTP Handler
12 var (
13     //go:embed index.html map.js
14     staticFS embed.FS
15
16     //go:embed map.html
17     mapHTML     string
18     mapTemplate *template.Template
19 )
20
21 type API struct {
22     log *slog.Logger
23 }

104 func main() {
105     log := slog.New(slog.NewTextHandler(os.Stdout, nil))
106     tmpl, err := template.New("map").Parse(mapHTML)
107     if err != nil {
108         log.Error("can't parse map HTML", "error", err)
109         os.Exit(1)
110     }
111     mapTemplate = tmpl
112
113     api := API{
114         log: log,
115     }
116
117     mux := http.NewServeMux()
118     mux.Handle("/", http.FileServer(http.FS(staticFS)))
119     mux.HandleFunc("/map", api.mapHandler)
120
121     addr := ":8080"
122     srv := http.Server{
123         Addr:              addr,
124         Handler:           mux,
125         ReadHeaderTimeout: time.Second,
126     }
127
128     log.Info("server starting", "address", addr)
129     if err := srv.ListenAndServe(); err != nil {
130         log.Error("can't serve", "error", err)
131         os.Exit(1)
132     }
133 }
Listing 8 shows how to start and run the HTTP service.
Conclusion
Leaflet JS is a great library for map visualization, it uses OpenStreetMap for which has many layers of detailed data. I find it very cool that it only took about 260 lines of Go and JavaScript code to generate an interactive map from raw GPX data.
Leaflet JS has many more capabilities, check out their web site for more demos.
There are two other takeaways from this blog. The first is the process: Decide on how you want the visualization to look and inspect the raw data. Once you have the end point and starting point you can start coding. The second takeaway is to not use the same data structures at all levels of your code. You don’t want to expose the data layer (GPX file format) structure to the business logic (aggregation) or to the API (UI layer). If you do that, changes in one layer will not be isolated.
The code is available at https://github.com/353words/leaflet.
How do you visualize map data? I’d love to hear from you at miki@ardanlabs.com.


