

Introduction
You are jogging and want to show off your route to your friends. Let’s imagine the data you have for your route is a CSV file in the following format:
Listing 1: track.csv
time,lat,lng,height
2015-08-20 03:48:07.235,32.519585,35.015021,136.1999969482422
2015-08-20 03:48:24.734,32.519606,35.014954,126.5999984741211
2015-08-20 03:48:25.660,32.519612,35.014871,123.0
2015-08-20 03:48:26.819,32.519654,35.014824,120.5
2015-08-20 03:48:27.828,32.519689,35.014776,118.9000015258789
2015-08-20 03:48:29.720,32.519691,35.014704,119.9000015258789
2015-08-20 03:48:30.669,32.519734,35.014657,120.9000015258789
Listing 1 shows the first few lines of track.csv. Each line contains a time stamp in UTC, latitude, longitude and height above sea level in meters.
Note: I’m not running at 3am, the times are in UTC and I live in Israel which is two hours ahead. It’s early, but not that early.
The actual track.csv file contains 740 rows of data, which is too much to show on a map. The plan is to load the data, then resample the data to select fewer points, and finally plot the data on a map by generating HTML that uses leaflet.
Let’s start!
Listing 2: Row struct
22 type Row struct {
23     Time   time.Time `csv:"time"`
24     Lat    float64   `csv:"lat"`
25     Lng    float64   `csv:"lng"`
26     Height float64   `csv:"height"`
27 }
Listing 2 shows the Row struct that is used by the csvutil package to parse the CSV file.
Listing 3: Unmarshaling Time
29 // unmarshalTime unmarshal data in CSV to time
30 func unmarshalTime(data []byte, t *time.Time) error {
31     var err error
32     *t, err = time.Parse("2006-01-02 15:04:05.000", string(data))
33     return err
34 }
Listing 3 shows unmarshalTime which is also used by csvutil to parse time stamps in the CSV file. On line 32, we use time.Parse to parse the time. I always forget how to format the time and find the constants section in the time package documentation helpful.
Listing 4: Loading CSV
36 // loadData loads data from CSV file, parses time in loc
37 func loadData(r io.Reader, loc *time.Location) ([]Row, error) {
38     var rows []Row
39     dec, err := csvutil.NewDecoder(csv.NewReader(r))
40     dec.Register(unmarshalTime)
41     if err != nil {
42         return nil, err
43     }
44
45     for {
46         var row Row
47         err := dec.Decode(&row)
48
49         if err == io.EOF {
50             break
51         }
52
53         if err != nil {
54             return nil, err
55         }
56
57         row.Time = row.Time.In(loc)
58         rows = append(rows, row)
59     }
60
61     return rows, nil
62 }
Listing 4 shows the loadData function that loads data from the CSV file. This function gets the CSV as io.Reader, which makes it more versatile and also easier to test. It also gets the time zone as a parameter since the data in the CSV is in UTC.
On line 39, we create a new decoder and on line 40, we register unmarshalTime to handle the time.Time fields. On lines 45 to 59, we iterate over the lines of the file decoding and loading. On line 57, we convert the time from UTC to the right time zone.
Listing 5: Mean of Rows
65 func meanRow(t time.Time, rows []Row) Row {
66     lat, lng, height := 0.0, 0.0, 0.0
67     for _, row := range rows {
68         lat += row.Lat
69         lng += row.Lng
70         height += row.Height
71     }
72
73     count := float64(len(rows))
74     return Row{
75         Time:   t,
76         Lat:    lat / count,
77         Lng:    lng / count,
78         Height: height / count,
79     }
80 }
Listing 5 shows the meanRow function that takes a slice of Row and returns a mean of type Row. On line 66, we initialize the means to 0, and on lines 67 to 70, we sum the fields. On lines 74 to 79, we return the mean row with the time and mean value for each field.
Before we take a look at the resample function, let’s understand what it does. Resampling is like a GROUP BY statement - we split the data in groups (called buckets in the code below) according to some criteria. In our case, we split the data to groups that fall within a specific time range. Once we grouped the data, for each group we return the group (the time) and a representing row. In the code below, we calculate the mean (sometimes called “average”) of each Row field.
Here’s an example - say we have the following made up data:
2015-08-20 03:48:07,32.0,42.0,10.0
2015-08-20 03:48:28,33.0,43.0,11.0
2015-08-20 03:48:52,34.0,44.0,12.0
2015-08-20 03:49:09,35.0,45.0,13.0
2015-08-20 03:49:37,36.0,46.0,14.0
When we resample to minute frequency, we first group the rows:
time: 2015-08-20 03:48
2015-08-20 03:48:07,32.0,42.0,10.0
2015-08-20 03:48:28,33.0,43.0,11.0
2015-08-20 03:48:52,34.0,44.0,12.0

time: 2015-08-20 03:49
2015-08-20 03:49:09,35.0,45.0,13.0
2015-08-20 03:49:37,36.0,46.0,14.0
Finally, for each group, we return the group (time) average of each field:
2015-08-20 03:48,33.0,43.0,11.0
2015-08-20 03:49,35.5,45.5,13.5
Back to the code …
Listing 6: Resampling
82 // resample resamples rows to freq, using mean to calculate values
83 func resample(rows []Row, freq time.Duration) []Row {
84     buckets := make(map[time.Time][]Row)
85     for _, row := range rows {
86         t := row.Time.Truncate(freq)
87         buckets[t] = append(buckets[t], row)
88     }
89
90     out := make([]Row, 0, len(buckets))
91     for t, rows := range buckets {
92         out = append(out, meanRow(t, rows))
93     }
94
95     sort.Slice(out, func(i, j int) bool { return rows[i].Time.Before(rows[j].Time) })
96     return out
97 }
Listing 6 shows how we resample the rows by time. On line 84, we create buckets which will hold all the rows that fall in the same time span and on lines 85 to 88, we fill the buckets. On line 90, we create the output slice and on lines 91 to 93, we fill the output slice with the mean rows for each bucket. Finally on line 95, we sort the output by time and return it on line 96.
Listing 7: HTML template variables
16 var (
17     //go:embed "template.html"
18     mapHTML     string
19     mapTemplate = template.Must(template.New("track").Parse(mapHTML))
20 )
Listing 7 shows the HTML template variables. On line 18, we define a mapHTML string variable, with an embed directive above it. On line 19, we define the mapTemplate using the Must function, the Must is used in var or init and will panic if there’s an error in the template.
Listing 8: The HTML Template
01 <!DOCTYPE html>
02 <html>
03     <head>
04         <title>Miki's Run</title>
05
06     <link rel="stylesheet" href="https://unpkg.com/leaflet@1.7.1/dist/leaflet.css" integrity="sha512-xodZBNTC5n17Xt2atTPuE1HxjVMSvLVW9ocqUKLsCC5CXdbqCmblAshOMAS6/keqq/sMZMZ19scR4PsZChSR7A==" crossorigin=""/>
07     <script src="https://unpkg.com/leaflet@1.7.1/dist/leaflet.js" integrity="sha512-XQoYMqMTK8LvdxXYG3nZ448hOEQiglfqkJs1NOQV44cWnUrBc8PkAOcXy20w0vlaXaVUearIOBhiXZ5V3ynxwA==" crossorigin=""></script>
08     <style>
09         #track {
10           width: 100%;
11           height: 800px;
12         }
13     </style>
14   </head>
15     <body>
16     <div id="track"></div>
17     <script>
18       var m = L.map('track').setView([{{.start.Lat}}, {{.start.Lng}}], 15);
19       L.tileLayer('https://api.mapbox.com/styles/v1/{id}/tiles/{z}/{x}/{y}?access_token={{.access_token}}', {
20         maxZoom: 18,
21         id: 'mapbox/streets-v11',
22         tileSize: 512,
23         zoomOffset: -1
24     }).addTo(m);
25
26       {{range .rows}}
27         L.circle([{{.Lat}}, {{.Lng}}], {
28             color: 'red',
29             radius: 20,
30         }).bindPopup('{{.Time.Format "15:04"}}').addTo(m);
31       {{end}}
32     </script>
33     </body>
34 </html>
Listing 8 shows template.html. On lines 6 and 7, we load leaflet CSS and javascript code. On lines 8-13, we set the dimensions for our map. On line 16, we define the HTML div that will hold the map. On line 18, we create the map with initial coordinates and zoom level. On lines 19 to 24, we load the tiles that will be displayed.
On lines 26, we iterate over the rows and on lines 27-30, we add a red circle marker with the time as a popup. On line 30, we use the time.Time.Format method inside the template to show only hour and minute.
Listing 9: main function
99 func main() {
100     file, err := os.Open("track.csv")
101     if err != nil {
102         log.Fatal(err)
103     }
104     defer file.Close()
105
106     loc, err := time.LoadLocation("Asia/Jerusalem")
107     if err != nil {
108         log.Fatal(err)
109     }
110
111     rows, err := loadData(file, loc)
112     if err != nil {
113         log.Fatal(err)
114     }
115
116     rows = resample(rows, time.Minute)
117
118     // Find token in https://account.mapbox.com/access-tokens/
119     accessToken := os.Getenv("MAPBOX_TOKEN")
120     if accessToken == "" {
121         log.Fatal("error: no access token, did you set MAPBOX_TOKEN?")
122     }
123
124     // Template data
125     data := map[string]interface{}{
126         "start":        rows[len(rows)/2],
127         "rows":         rows,
128         "access_token": accessToken,
129     }
130     if err := mapTemplate.Execute(os.Stdout, data); err != nil {
131         log.Fatal(err)
132     }
133 }
Listing 9 shows the main function. On line 100, we open the CSV file and on line 106, we load Israel’s time zone. On line 111, we load the data and on line 116, we resample it to a minute frequency.
Next we generate the HTML for the map. On line 119, we get the mapbox access token from the environment and on lines 125 to 129, we create the data passed to the HTML template. Finally on line 130, we execute the template on the data to standard output.
Listing 10: Running the Code
$ go run . > track.html
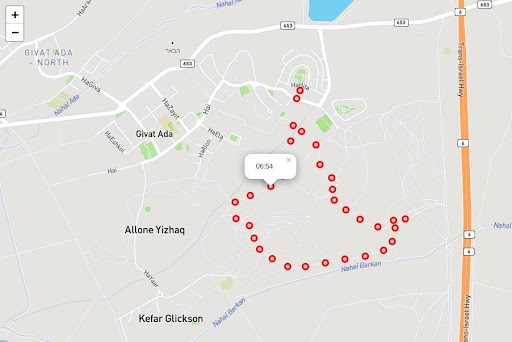
Listing 10 shows how to run the code. When you’ll open the generated track.html in the browser you’ll see a map similar to this.
Conclusion
In about 150 lines of Go and HTML template, we loaded data from CSV, parsed it, resampled, and generated an interactive map. You don’t have to use fancy geographic tools (called GIS) to show data on maps, using Go to “glue” CSV and leaflet (which uses OpenStreetMap under the hood) is fun. I encourage you to learn more about leaflet, it’s a wonderful library that has a lot of capabilities.
You can view the source code to this blog post on github.


