Introduction
I have spent a career building business applications that work with databases, starting with SQL and then moving to No-SQL. I’ve been curious how Graph databases work and how to build applications with them. It seems the sweet spot for a Graph database is when your application needs to model the interrelationships of complex and different datasets. I’ve been using No-SQL databases for these types of applications so I am super interested in knowing how Graph databases differ. After some research, I decided to learn Dgraph and their modified version of GraphQL called GraphQL+-.
Dgraph is written in Go and is a relatively new player in the Graph database market. GraphQL is becoming the new DSL for interacting with the database. Since GraphQL wasn’t developed directly for Graph databases, Dgraph modified the language (adding and removing features) to better support graph operations and called it GraphQL+-. However when interacting with Dgraph, you do have the choice of using native GraphQL as well.
Note: Dgraph is working on full native support for GraphQL in an upcoming release. You can start experimenting with it now. Native GraphQL will be available to perform basic CRUD and other simple operations. However, you will need GraphQL+- to make use of the the full potential of the database.
In this post, I will show you how to install and run a standalone version of Dgraph for use in your development environment. Then I will walk you through a simple example using Dgraph’s UI browser tool Ratel to store and query data from the database using GraphQL+-.
Docker
The best way to run Dgraph on your local machine is to use Docker. If you don’t have Docker installed yet, then please use this guide from Docker.
As of the writing of this post, version 20.03.0 is the latest release of the database. To download this version of the Dgraph image, just use the docker pull command.
Listing 1
$ docker pull dgraph/standalone:v20.03.0

OUTPUT
v20.03.0: Pulling from dgraph/dgraph
6abc03819f3e: Pull complete
05731e63f211: Pull complete
0bd67c50d6be: Pull complete
2f379a822eb5: Pull complete
a676ba663810: Pull complete
971811531d21: Pull complete
7ea90bf23378: Pull complete
f017dbb5d80b: Pull complete
Digest: sha256:92aac5559d4040571bfae5e84a946101be0f31971950893fd32de7adeeefc15d
Status: Downloaded newer image for dgraph/standalone:v20.03.0
docker.io/dgraph/standalone:v20.03.0
Listing 1 shows the docker pull command that will download a standalone version of Dgraph and prepare Dgraph to run inside a container. Once all the different file layers are downloaded, you can run the docker images command to validate the pull.
Listing 2
$ docker images

OUTPUT
REPOSITORY          TAG        IMAGE ID       CREATED       SIZE
dgraph/standalone   v20.03.0   6875d1f402fa   10 days ago    153MB
Listing 2 shows the call to docker images and the expected output for the Dgraph image. To validate this image works, attempt to run the container.
Listing 3
$ docker run -it -p 8080:8080 -p 9080:9080 -p 8000:8000 dgraph/standalone:v20.03.0

OUTPUT
Warning: This standalone version is meant for quickstart purposes only.
         It is NOT RECOMMENDED for production environments.
2020/04/10 14:07:40 Listening on :8000...
[Decoder]: Using assembly version of decoder
Listing 3 shows the docker run command to use to get Dgraph up and running. Notice the message about this version of Dgraph is not meant for production use. You will use this version for local development and testing. Also notice the three ports that should be exposed: 8080, 9080, and 8000.
To verify this standalone version is working, open your browser and navigate to localhost:8000.
Figure 1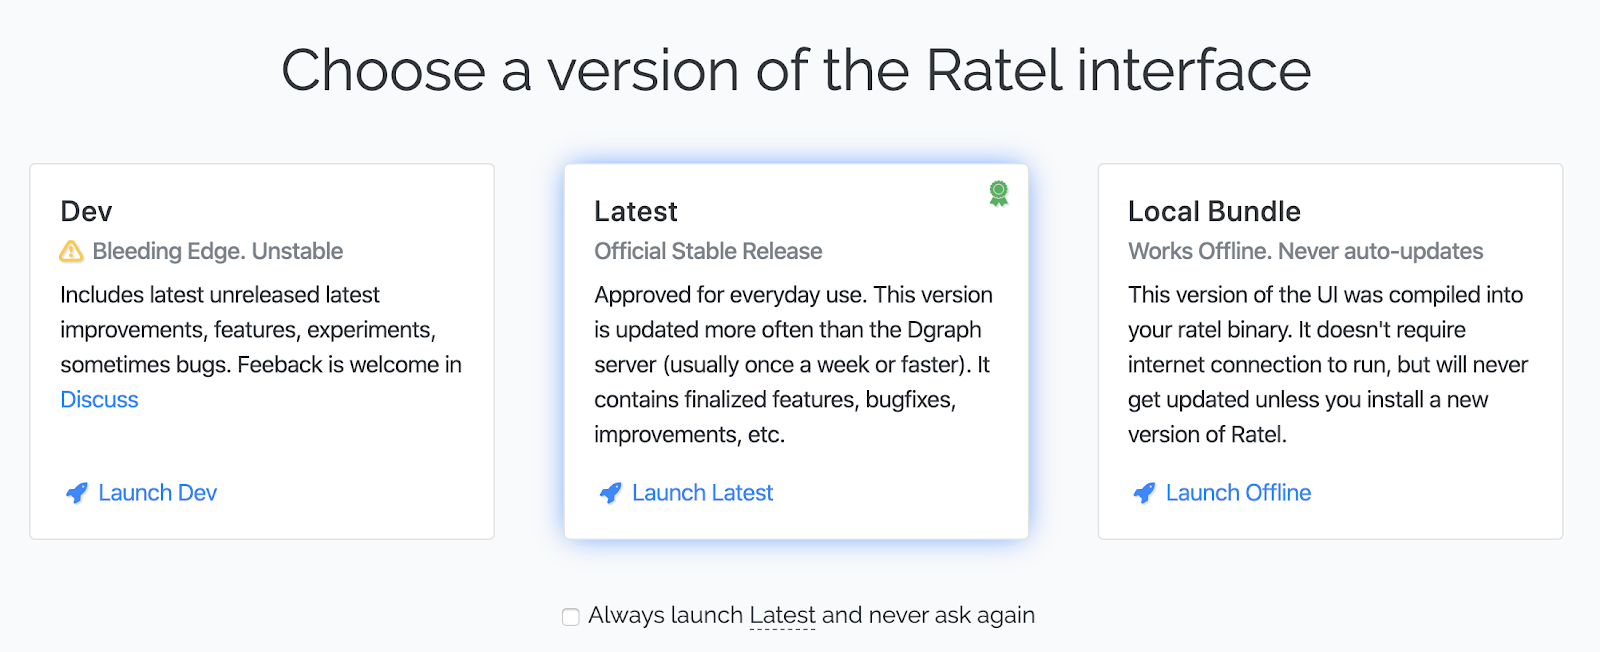
Figure 1 shows the home page to access the Dgraph tool for interacting with the database. Click on the center box to run the Latest version if you want to explore more.
To stop and remove the container, find the container id and then use the docker stop and docker rm command.
Listing 4
$ docker ps

OUTPUT
CONTAINER ID     IMAGE                         COMMAND
fdf70d833dd8     dgraph/standalone:v20.03.0    "./run.sh"

$ docker stop fdf70d833dd8
$ docker rm fdf70d833dd8

OUTPUT
Listing 4 shows how to find the id of the running Dgraph container and then stop and remove it. You can also hit
Basic Example
I will walk you through a basic example of defining nodes and a single edge to be stored and queried in Dgraph. In this example, I will use a couple of people I follow on Twitter.
Figure 2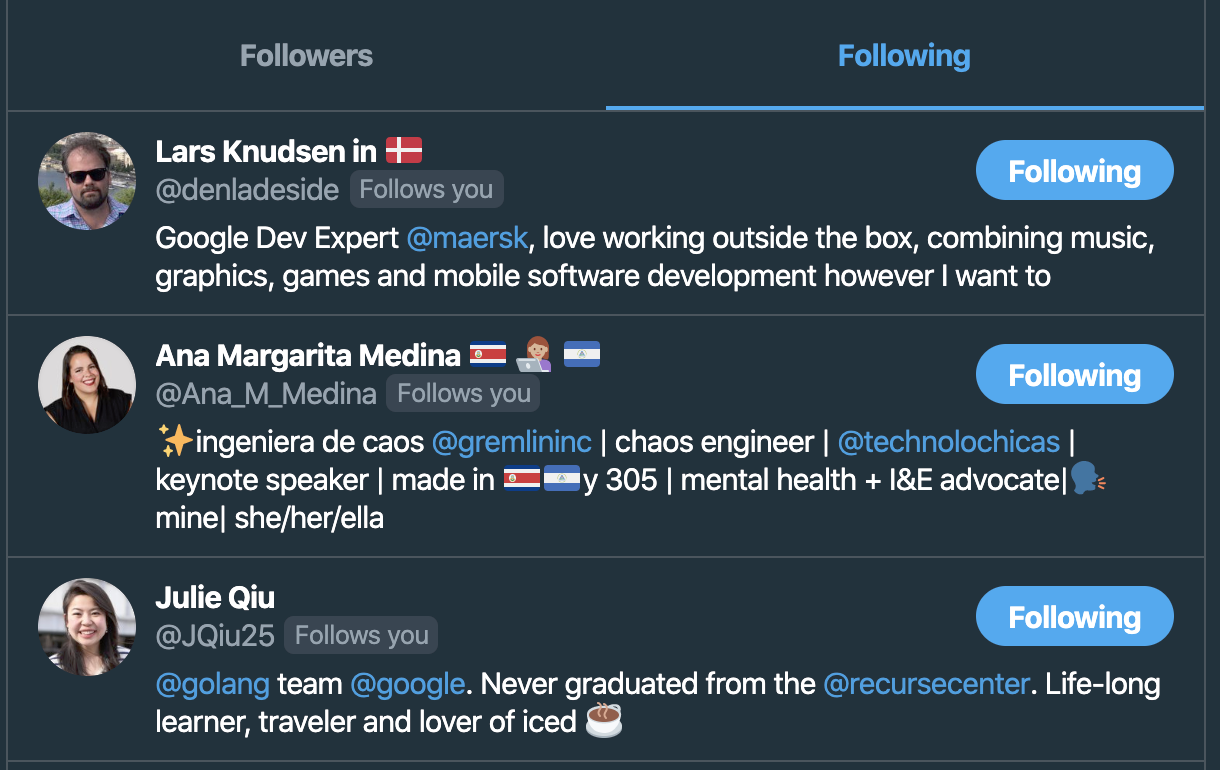
Figure 2 shows a list of three people (Lars, Ana and Julie) who I follow on Twitter. This is the relationship I am going to re-create in Dgraph.
To begin, I will start the Dgraph service with the Docker command from listing 3 and then open my browser to localhost:8000 to start running the latest version of Dgraph’s Ratel browser tool.
Figure 3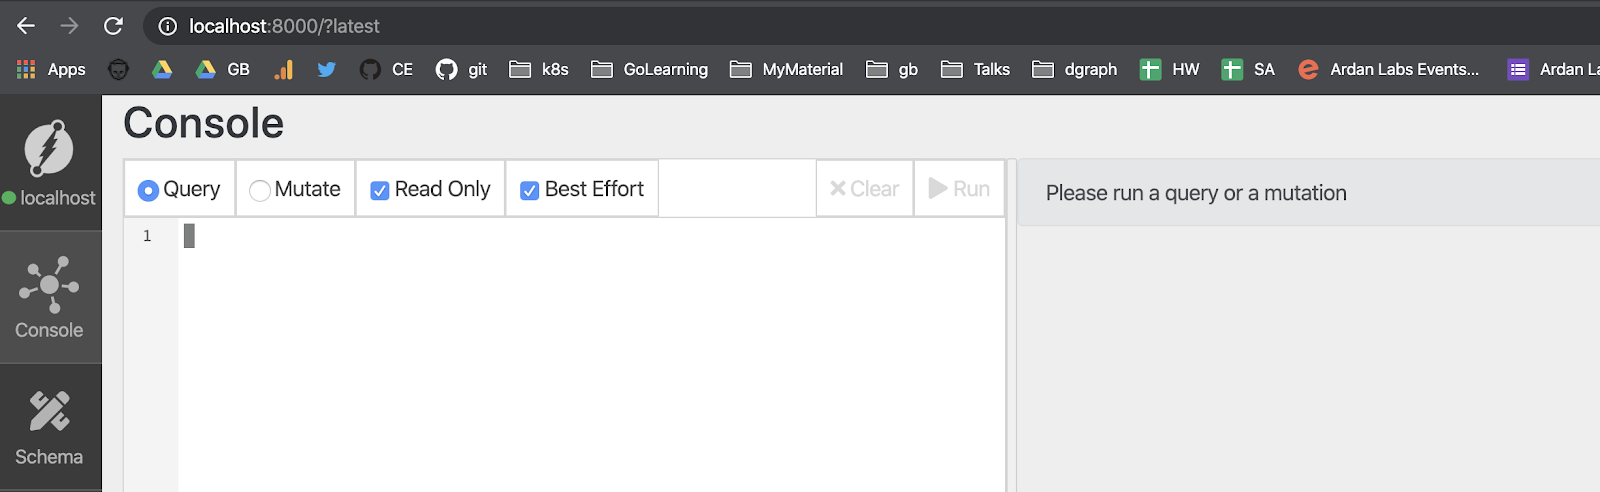
Figure 3 shows a view of Ratel, Dgraph’s interactive browser tool for working with a running instance of Dgraph.
Nodes and Edges
The first step is to load data into Dgraph about myself and the people I follow. This can be accomplished by defining the data using a JSON document.
Listing 5
{
  "set": [{
    "name": "Bill",
    "country": "USA",
    "city": "Miami",
    "follows": [{
      "name": "Lars",
      "country": "Denmark",
      "city": "Copenhagen"
    },
    {
      "name": "Ana",
      "country": "San Francisco",
      "city": "California"
    },
    {
      "name": "Julie",
      "country": "USA",
      "city": "New York"
    }
    ]
  }]
}
Listing 5 shows a JSON document you can use to define and store the data in Dgraph with the relationships I want to model. Before you store this data into Dgraph, I want to break the document into the nodes and edges that are being modeled.
Listing 6
{
  "set": [{
    "name": "Bill",                <----------
    "country": "USA",                        | - Node 1 Bill
    "city": "Miami",               <----------

    "follows": [  <----------| Edge between Node 1 and Nodes 2, 3, and 4

    {
      "name": "Lars",              <----------
      "country": "Denmark",                  | - Node 2 Lars
      "city": "Copenhagen"         <----------
    },
    {
      "name": "Ana",               <----------
      "country": "San Francisco",            | - Node 3 Ana
      "city": "California"         <----------
    },
    {
      "name": "Julie",             <----------
      "country": "USA",                      | - Node 4 Julie
      "city": "New York"           <----------
    }
    ]
  }]
}
Listing 6 breaks down the JSON document into nodes and edges. You can see there are 4 nodes, one for each person (Bill, Lars, Ana, and Juile) and there is an edge defined by the follows field. The follows field in this data set will create 3 edges, one between Bill and each of the people he follows: Lars, Ana and Julie.
Mutations
With the nodes and edges defined, it’s time to run a mutation against Dgraph to create the data inside the database. Take the JSON document from listing 5 and copy it into Ratel.
Figure 4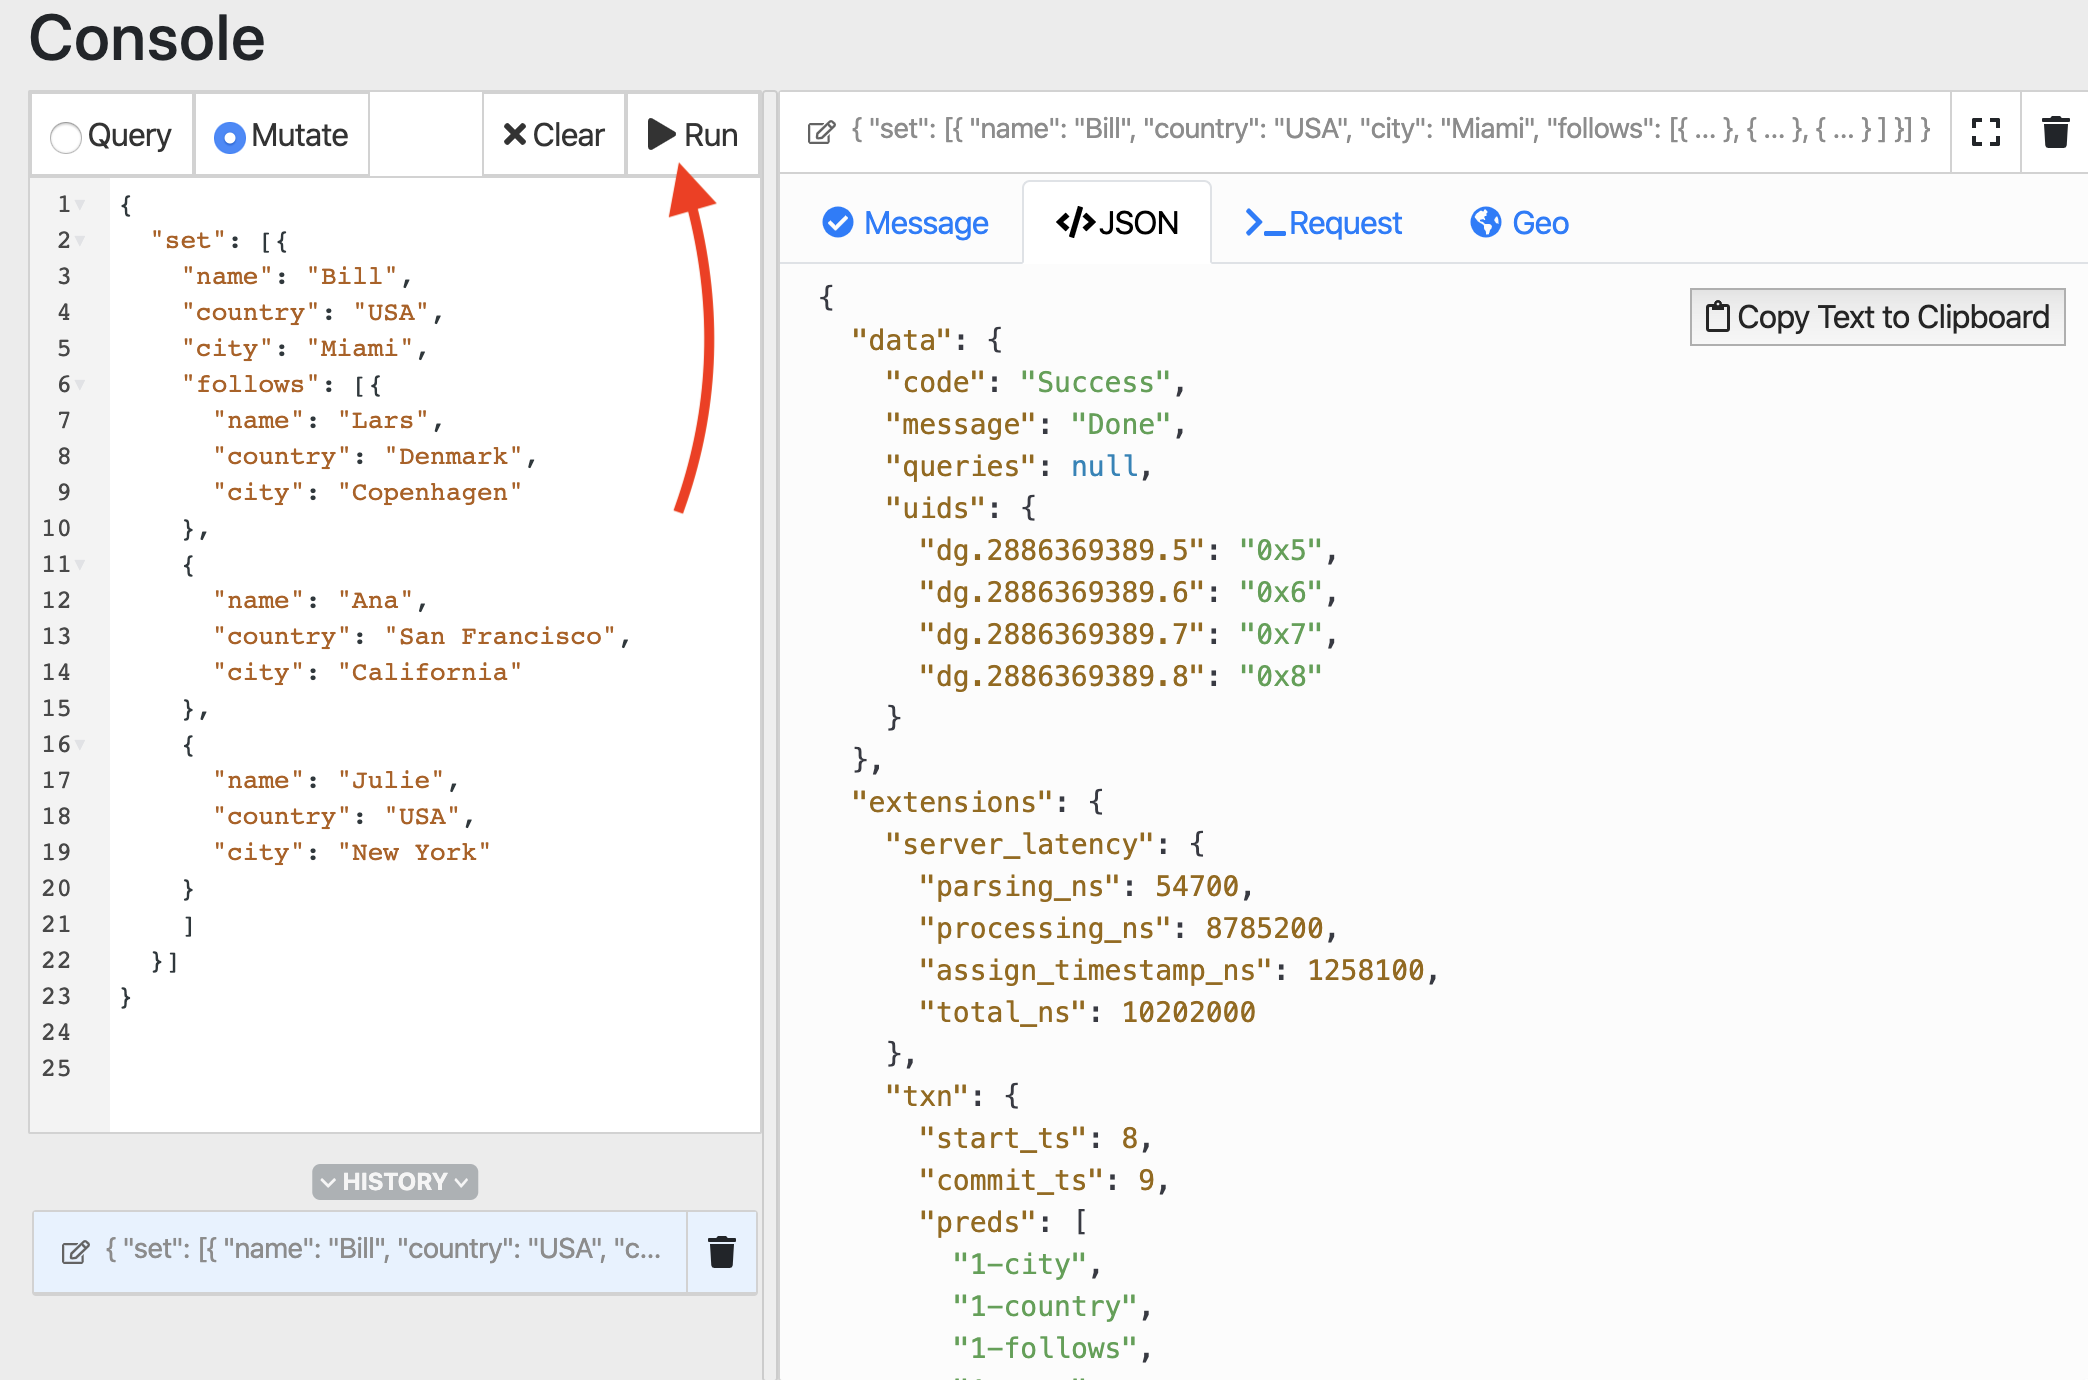
The left side of figure 4 shows what Ratel should look like after you copy the JSON document from listing 5 into Ratel. Don’t forget to select the Mutate radio button first. Then hit the Run button indicated by the red arrow. After you hit Run, select the JSON tab on the right hand side. You should see that the mutation was a success.
Queries
To query the data out of Dgraph, I will use a GraphQL+- query. If the query is formed correctly, you will also be able to see a graph of the relationships.
Listing 7
{
  people(func: has(name)) {
    name
    country
    city
    follows {
      name
      country
      city
    }
  }
}
Listing 7 shows the query to run. This query asks for all people who have a name. Then it asks for the name, country, city and followers for each person. For each follower, the person’s name, country and city is also returned. If you notice the query matches the structure of the data that was stored inside of Dgraph.
Figure 5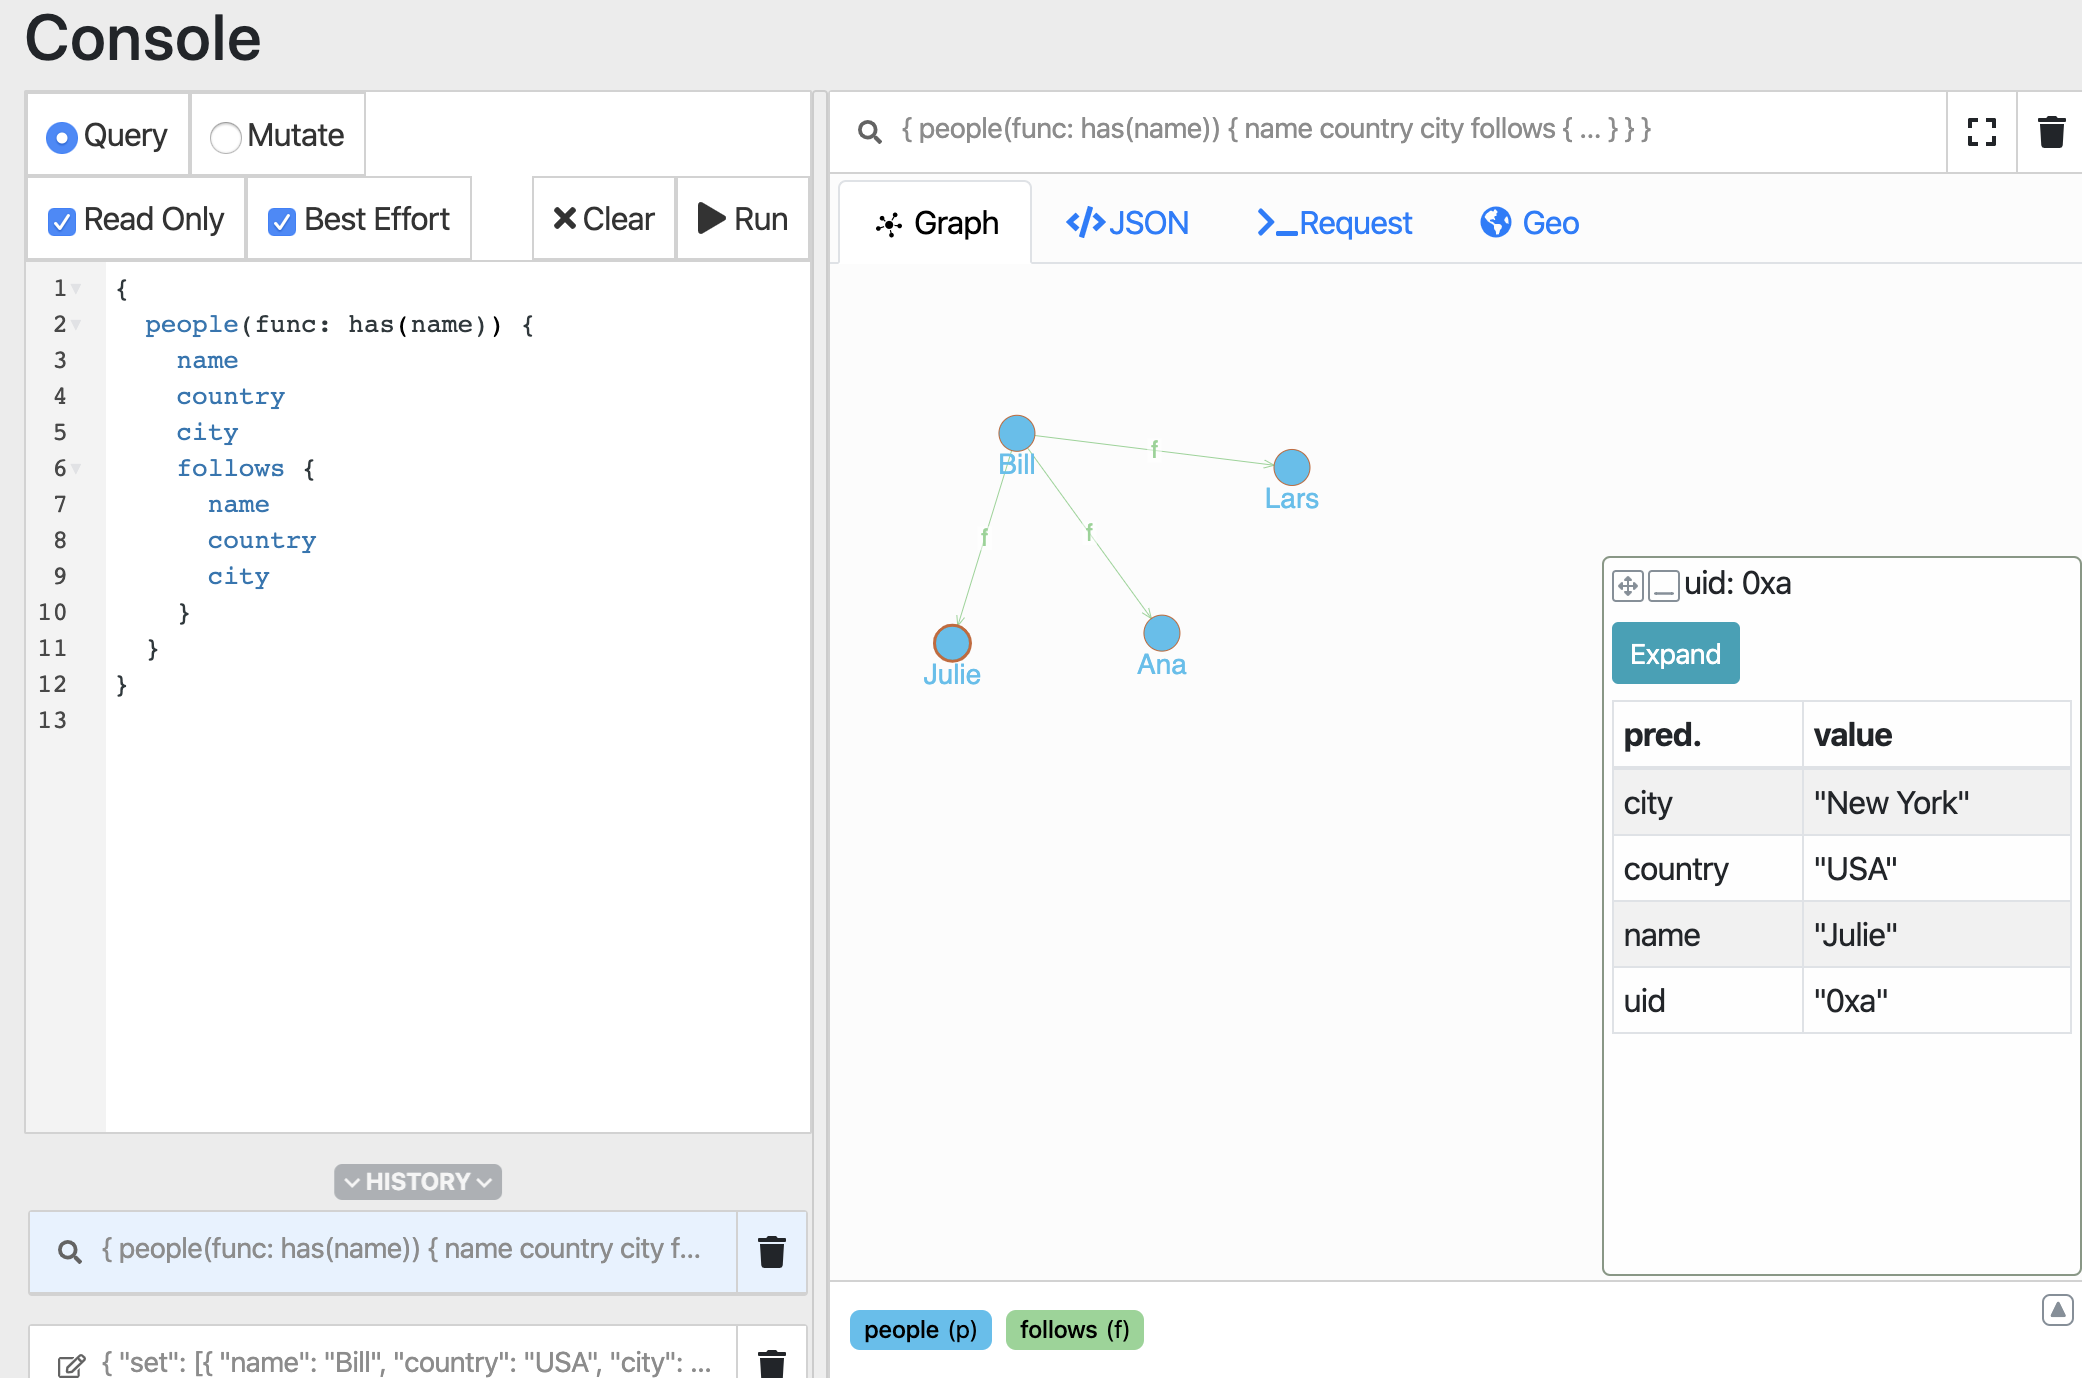
Figure 5 shows the result of running the query defined in listing 7. Don’t forget to switch to Query mode in the UI before running the query. If you select the Graph view on the right side, you will see a visualization of the relationships between Bill and the others. Each circle represents a node and the lines represent an edge between those nodes. If you select a person (like Julie) you will get the detailed information returned from the query. You can see that detailed information in the box at the bottom right hand corner of the tool.
Dgraph Tour
If you want to take Dgraph for a larger test drive, then review this introductory tour of Dgraph. Everything on this page will work with the local development image of Dgraph we installed.
Conclusion
There is a lot more to come in teaching you how to effectively work with Dgraph and GraphQL to build applications. This post was just a starter to show you how quickly you can get a Dgraph service up and running for development and how to use the Dgraph Ratel tool to help you learn GraphQL.
Here are some links to help jump start your learning while I work on the next post.
Dgraph index of documentation
https://dgraph.io/docs/
Dgraph blog for supplemental tutorials and announcements
https://dgraph.io/blog/
Dgraph Go Module for building Go applications
https://github.com/dgraph-io/dgo