Although this blogpost was originally published in 2018, the concepts and principles discussed remain crucial for building efficient and performant multithreaded applications in Go now in 2025 (Go 1.24.0). As the Go ecosystem continues to evolve, understanding how the Go scheduler interacts with the operating system scheduler is more important than ever. This three-part series provides a comprehensive overview of the mechanics and semantics behind Go’s scheduling, starting with the fundamentals of the operating system scheduler.
Prelude
This is the first post in a three part series that will provide an understanding of the mechanics and semantics behind the scheduler in Go. This post focuses on the operating system scheduler.
Index of the three part series:
- Scheduling In Go : Part I - OS Scheduler
- Scheduling In Go : Part II - Go Scheduler
- Scheduling In Go : Part III - Concurrency
Introduction
The design and behavior of the Go scheduler allows your multithreaded Go programs to be more efficient and performant. This is thanks to the mechanical sympathies the Go scheduler has for the operating system (OS) scheduler. However, if the design and behavior of your multithreaded Go software is not mechanically sympathetic with how the schedulers work, none of this will matter. It’s important to have a general and representative understanding of how both the OS and Go schedulers work to design your multithreaded software correctly.
This multi-part article will focus on the higher-level mechanics and semantics of the schedulers. I will provide enough details to allow you to visualize how things work so you can make better engineering decisions. Even though there is a lot that goes into the engineering decisions you need to make for multithreaded applications, the mechanics and semantics form a critical part of the foundational knowledge you need.
OS Scheduler
Operating-system schedulers are complex pieces of software. They have to take into account the layout and setup of the hardware they run on. This includes but is not limited to the existence of multiple processors and cores, CPU caches and NUMA. Without this knowledge, the scheduler can’t be as efficient as possible. What’s great is you can still develop a good mental model of how the OS scheduler works without going deep into these topics.
Your program is just a series of machine instructions that need to be executed one after the other sequentially. To make that happen, the operating system uses the concept of a Thread. It’s the job of the Thread to account for and sequentially execute the set of instructions it’s assigned. Execution continues until there are no more instructions for the Thread to execute. This is why I call a Thread, “a path of execution”.
Every program you run creates a Process and each Process is given an initial Thread. Threads have the ability to create more Threads. All these different Threads run independently of each other and scheduling decisions are made at the Thread level, not at the Process level. Threads can run concurrently (each taking a turn on an individual core), or in parallel (each running at the same time on different cores). Threads also maintain their own state to allow for the safe, local, and independent execution of their instructions.
The OS scheduler is responsible for making sure cores are not idle if there are Threads that can be executing. It must also create the illusion that all the Threads that can execute are executing at the same time. In the process of creating this illusion, the scheduler needs to run Threads with a higher priority over lower priority Threads. However, Threads with a lower priority can’t be starved of execution time. The scheduler also needs to minimize scheduling latencies as much as possible by making quick and smart decisions.
A lot goes into the algorithms to make this happen, but luckily there are decades of work and experience the industry is able to leverage. To understand all of this better, it’s good to describe and define a few concepts that are important.
Executing Instructions
The program counter (PC), which is sometimes called the instruction pointer (IP), is what allows the Thread to keep track of the next instruction to execute. In most processors, the PC points to the next instruction and not the current instruction.
Figure 1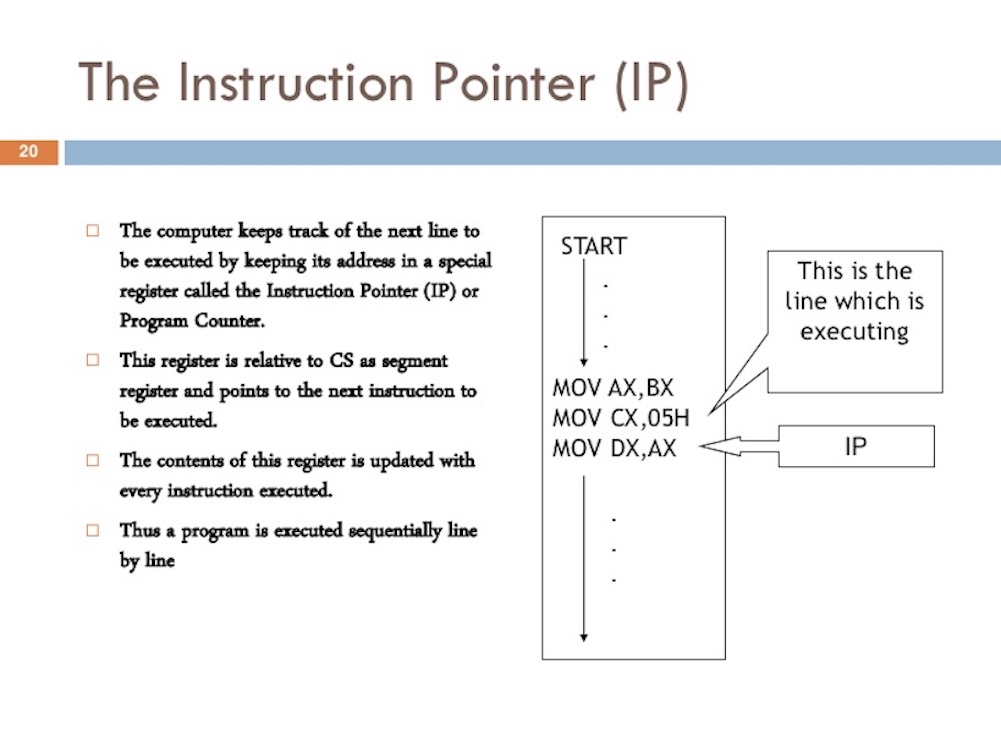 https://www.slideshare.net/JohnCutajar/assembly-language-8086-intermediate
If you have ever seen a stack trace from a Go program, you might have noticed these small hexadecimal numbers at the end of each line. Look for +0x39 and +0x72 in Listing 1.
Listing 1
goroutine 1 [running]:
   main.example(0xc000042748, 0x2, 0x4, 0x106abae, 0x5, 0xa)
       stack_trace/example1/example1.go:13 +0x39                 <- LOOK HERE
   main.main()
       stack_trace/example1/example1.go:8 +0x72                  <- LOOK HERE
Those numbers represent the PC value offset from the top of the respective function. The +0x39 PC offset value represents the next instruction the Thread would have executed inside the example function if the program hadn’t panicked. The 0+x72 PC offset value is the next instruction inside the main function if control happened to go back to that function. More important, the instruction prior to that pointer tells you what instruction was executing.
Look at the program below in Listing 2 which caused the stack trace from Listing 1.
Listing 2
https://github.com/ardanlabs/gotraining/blob/master/topics/go/profiling/stack_trace/example1/example1.go

07 func main() {
08     example(make([]string, 2, 4), "hello", 10)
09 }

12 func example(slice []string, str string, i int) {
13    panic("Want stack trace")
14 }
The hex number +0x39 represents the PC offset for an instruction inside the example function which is 57 (base 10) bytes below the starting instruction for the function. In Listing 3 below, you can see an objdump of the example function from the binary. Find the 12th instruction, which is listed at the bottom. Notice the line of code above that instruction is the call to panic.
Listing 3
$ go tool objdump -S -s "main.example" ./example1
TEXT main.example(SB) stack_trace/example1/example1.go
func example(slice []string, str string, i int) {
  0x104dfa0		65488b0c2530000000	MOVQ GS:0x30, CX
  0x104dfa9		483b6110		CMPQ 0x10(CX), SP
  0x104dfad		762c			JBE 0x104dfdb
  0x104dfaf		4883ec18		SUBQ $0x18, SP
  0x104dfb3		48896c2410		MOVQ BP, 0x10(SP)
  0x104dfb8		488d6c2410		LEAQ 0x10(SP), BP
	panic("Want stack trace")
  0x104dfbd		488d059ca20000	LEAQ runtime.types+41504(SB), AX
  0x104dfc4		48890424		MOVQ AX, 0(SP)
  0x104dfc8		488d05a1870200	LEAQ main.statictmp_0(SB), AX
  0x104dfcf		4889442408		MOVQ AX, 0x8(SP)
  0x104dfd4		e8c735fdff		CALL runtime.gopanic(SB)
  0x104dfd9		0f0b			UD2              <--- LOOK HERE PC(+0x39)
Remember: the PC is the next instruction, not the current one. Listing 3 is a good example of the amd64 based instructions that the Thread for this Go program is in charge of executing sequentially.
Thread States
Another important concept is Thread state, which dictates the role the scheduler takes with the Thread. A Thread can be in one of three states: Waiting, Runnable or Executing.
Waiting: This means the Thread is stopped and waiting for something in order to continue. This could be for reasons like, waiting for the hardware (disk, network), the operating system (system calls) or synchronization calls (atomic, mutexes). These types of latencies are a root cause for bad performance.
Runnable: This means the Thread wants time on a core so it can execute its assigned machine instructions. If you have a lot of Threads that want time, then Threads have to wait longer to get time. Also, the individual amount of time any given Thread gets is shortened, as more Threads compete for time. This type of scheduling latency can also be a cause of bad performance.
Executing: This means the Thread has been placed on a core and is executing its machine instructions. The work related to the application is getting done. This is what everyone wants.
Types Of Work
There are two types of work a Thread can do. The first is called CPU-Bound and the second is called IO-Bound.
CPU-Bound: This is work that never creates a situation where the Thread may be placed in Waiting states. This is work that is constantly making calculations. A Thread calculating Pi to the Nth digit would be CPU-Bound.
IO-Bound: This is work that causes Threads to enter into Waiting states. This is work that consists in requesting access to a resource over the network or making system calls into the operating system. A Thread that needs to access a database would be IO-Bound. I would include synchronization events (mutexes, atomic), that cause the Thread to wait as part of this category.
Context Switching
If you are running on Linux, Mac or Windows, you are running on an OS that has a preemptive scheduler. This means a few important things. First, it means the scheduler is unpredictable when it comes to what Threads will be chosen to run at any given time. Thread priorities together with events, (like receiving data on the network) make it impossible to determine what the scheduler will choose to do and when.
Second, it means you must never write code based on some perceived behavior that you have been lucky to experience but is not guaranteed to take place every time. It is easy to allow yourself to think, because I’ve seen this happen the same way 1000 times, this is guaranteed behavior. You must control the synchronization and orchestration of Threads if you need determinism in your application.
The physical act of swapping Threads on a core is called a context switch. A context switch happens when the scheduler pulls an Executing thread off a core and replaces it with a Runnable Thread. The Thread that was selected from the run queue moves into an Executing state. The Thread that was pulled can move back into a Runnable state (if it still has the ability to run), or into a Waiting state (if was replaced because of an IO-Bound type of request).
Context switches are considered to be expensive because it takes times to swap Threads on and off a core. The amount of latency incurrent during a context switch depends on different factors but it’s not unreasonable for it to take between ~1000 and ~1500 nanoseconds. Considering the hardware should be able to reasonably execute (on average) 12 instructions per nanosecond per core, a context switch can cost you ~12k to ~18k instructions of latency. In essence, your program is losing the ability to execute a large number of instructions during a context switch.
If you have a program that is focused on IO-Bound work, then context switches are going to be an advantage. Once a Thread moves into a Waiting state, another Thread in a Runnable state is there to take its place. This allows the core to always be doing work. This is one of the most important aspects of scheduling. Don’t allow a core to go idle if there is work (Threads in a Runnable state) to be done.
If your program is focused on CPU-Bound work, then context switches are going to be a performance nightmare. Since the Thead always has work to do, the context switch is stopping that work from progressing. This situation is in stark contrast with what happens with an IO-Bound workload
Less Is More
In the early days when processors had only one core, scheduling wasn’t overly complicated. Because you had a single processor with a single core, only one Thread could execute at any given time. The idea was to define a scheduler period and attempt to execute all the Runnable Threads within that period of time. No problem: take the scheduling period and divide it by the number of Threads that need to execute.
As an example, if you define your scheduler period to be 1000ms (1 second) and you have 10 Threads, then each thread gets 100ms each. If you have 100 Threads, each Thread gets 10ms each. However, what happens when you have 1000 Threads? Giving each Thread a time slice of 1ms doesn’t work because the percentage of time you’re spending in context switches will be significant related to the amount of time you’re spending on application work.
What you need is to set a limit on how small a given time slice can be. In the last scenario, if the minimum time slice was 10ms and you have 1000 Threads, the scheduler period needs to increase to 10000ms (10 seconds). What if there were 10,000 Threads, now you are looking at a scheduler period of 100000ms (100 seconds). At 10,000 threads, with a minimal time slice of 10ms, it takes 100 seconds for all the Threads to run once in this simple example if each Thread uses its full time slice.
Be aware this is a very simple view of the world. There are more things that need to be considered and handled by the scheduler when making scheduling decisions. You control the number of Threads you use in your application. When there are more Threads to consider, and IO-Bound work happening, there is more chaos and nondeterministic behavior. Things take longer to schedule and execute.
This is why the rule of the game is “Less is More”. Less Threads in a Runnable state means less scheduling overhead and more time each Thread gets over time. More Threads in a Runnable state mean less time each Thread gets over time. That means less of your work is getting done over time as well.
Find The Balance
There is a balance you need to find between the number of cores you have and the number of Threads you need to get the best throughput for your application. When it comes to managing this balance, Thread pools were a great answer. I will show you in part II that this is no longer necessary with Go. I think this is one of the nice things Go did to make multithreaded application development easier.
Prior to coding in Go, I wrote code in C++ and C# on NT. On that operating system, the use of IOCP (IO Completion Ports) thread pools were critical to writing multithreaded software. As an engineer, you needed to figure out how many Thread pools you needed and the max number of Threads for any given pool to maximize throughput for the number of cores that you were given.
When writing web services that talked to a database, the magic number of 3 Threads per core seemed to always give the best throughput on NT. In other words, 3 Threads per core minimized the latency costs of context switching while maximizing execution time on the cores. When creating an IOCP Thread pool, I knew to start with a minimum of 1 Thread and a maximum of 3 Threads for every core I identified on the host machine.
If I used 2 Threads per core, it took longer to get all the work done, because I had idle time when I could have been getting work done. If I used 4 Threads per core, it also took longer, because I had more latency in context switches. The balance of 3 Threads per core, for whatever reason, always seemed to be the magic number on NT.
What if your service is doing a lot of different types of work? That could create different and inconsistent latencies. Maybe it also creates a lot of different system-level events that need to be handled. It might not be possible to find a magic number that works all the time for all the different work loads. When it comes to using Thread pools to tune the performance of a service, it can get very complicated to find the right consistent configuration.
Cache Lines
Accessing data from main memory has such a high latency cost (~100 to ~300 clock cycles) that processors and cores have local caches to keep data close to the hardware threads that need it. Accessing data from caches have a much lower cost (~3 to ~40 clock cycles) depending on the cache being accessed. Today, one aspect of performance is about how efficiently you can get data into the processor to reduce these data-access latencies. Writing multithreaded applications that mutate state need to consider the mechanics of the caching system.
Figure 2
Data is exchanged between the processor and main memory using cache lines. A cache line is a 64-byte chunk of memory that is exchanged between main memory and the caching system. Each core is given its own copy of any cache line it needs, which means the hardware uses value semantics. This is why mutations to memory in multithreaded applications can create performance nightmares.
When multiple Threads running in parallel are accessing the same data value or even data values near one another, they will be accessing data on the same cache line. Any Thread running on any core will get its own copy of that same cache line.
Figure 3
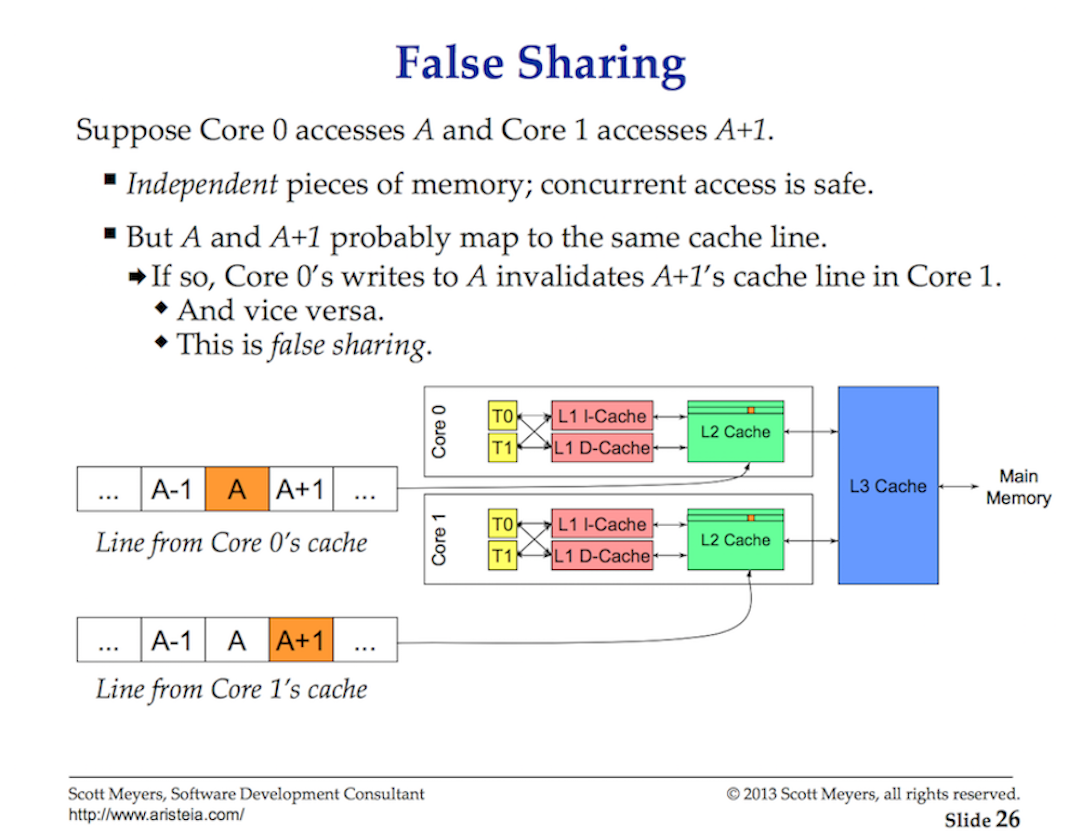
If one Thread on a given core makes a change to its copy of the cache line, then through the magic of hardware, all other copies of the same cache line have to be marked dirty. When a Thread attempts read or write access to a dirty cache line, main memory access (~100 to ~300 clock cycles) is required to get a new copy of the cache line.
Maybe on a 2-core processor this isn’t a big deal, but what about a 32-core processor running 32 threads in parallel all accessing and mutating data on the same cache line? What about a system with two physical processors with 16 cores each? This is going to be worse because of the added latency for processor-to-processor communication. The application is going to be thrashing through memory and the performance is going to be horrible and, most likely, you will have no understanding why.
This is called the cache-coherency problem and also introduces problems like false sharing. When writing multithreaded applications that will be mutating shared state, the caching systems have to be taken into account.
Scheduling Decision Scenario
Imagine I’ve asked you to write the OS scheduler based on the high-level information I’ve given you. Think about this one scenario that you have to consider. Remember, this is one of many interesting things the scheduler has to consider when making a scheduling decision.
You start your application and the main Thread is created and is executing on core 1. As the Thread starts executing its instructions, cache lines are being retrieved because data is required. The Thread now decides to create a new Thread for some concurrent processing. Here is the question.
Once the Thread is created and ready to go, should the scheduler:
- Context-switch the main Thread off of core 1? Doing this could help performance, as the chances that this new Thread needs the same data that is already cached is pretty good. But the main Thread does not get its full time slice.
- Have the Thread wait for core 1 to become available pending the completion of the main Thread’s time slice? The Thread is not running but latency on fetching data will be eliminated once it starts.
- Have the Thread wait for the next available core? This would mean cache lines for the selected core would be flushed, retrieved, and duplicated, causing latency. However, the Thread would start more quickly and the main Thread could finish its time slice.
Having fun yet? These are interesting questions that the OS scheduler needs to take into account when making scheduling decisions. Luckily for everyone, I’m not the one making them. All I can tell you is that, if there is an idle core, it’s going to be used. You want Threads running when they can be running.
Conclusion
This first part of the post provides insights into what you have to consider regarding Threads and the OS scheduler when writing multithreaded applications. These are the things the Go scheduler takes into consideration as well. In the next post, I will described the semantics of the Go scheduler and how they related back to this information. Then finally, you will see all of this in action by running a couple programs.