Introduction
One of the things I love about Go is the profiling and debug information you can generate. There is a special environmental variable named GODEBUG that will emit debugging information about the runtime as your program executes. You can request summary and detailed information for both the garbage collector and the scheduler. What’s great is you don’t need to build your program with any special switches for it to work.
In this post, I will show you how to interpret the scheduler trace information from a sample concurrent Go program. It will help if you have a basic understanding of the scheduler. I recommend reading these two posts before continuing:
Concurrency, Goroutines and GOMAXPROCS
https://www.ardanlabs.com/blog/2014/01/concurrency-goroutines-and-gomaxprocs.html
Go Scheduler
http://morsmachine.dk/go-scheduler
The Code
This is the sample program we will use to inspect and interpret the results from GODEBUG:
Listing 1
01 package main
02
03 import (
04 "sync"
05 "time"
06 )
07
08 func main() {
09 var wg sync.WaitGroup
10 wg.Add(10)
11
12 for i := 0; i < 10; i++ {
13 go work(&wg)
14 }
15
16 wg.Wait()
17
18 // Wait to see the global run queue deplete.
19 time.Sleep(3 * time.Second)
20 }
21
22 func work(wg *sync.WaitGroup) {
23 time.Sleep(time.Second)
24
25 var counter int
26 for i := 0; i < 1e10; i++ {
27 counter++
28 }
29
30 wg.Done()
31 }
The code in listing 1 is designed to be predictable against the debug information we expect to see emitted by the runtime. On line 12, a for loop is declared to create ten goroutines. Then the main function waits on line 16 for all the goroutines to finish their work. The work function on line 22 sleeps for one second and then increments a local variable ten billion times. Once the incrementing is done, the function calls Done on the wait group and returns.
It is a good idea to build your program with go build first, before setting the options for GODEBUG. This variable is picked up by the runtime, so running Go commands will produce tracing output as well. If you use GODEBUG in conjunction with go run for example, then you will see trace information for the build prior to your program running.
Now let’s build the program so we can run it with the GODEBUG scheduler option:
go build example.go
Scheduler Summary Trace
The schedtrace option causes the runtime to emit a single summary line about the scheduler’s state to standard error every X milliseconds. Let’s run the program, setting the GODEBUG option at the same time:
GOMAXPROCS=1 GODEBUG=schedtrace=1000 ./example
Once the program starts running we will see the tracing begin. The program itself does not output anything to standard out or standard error, so we can just focus on the traces. Let’s look at the first two traces that are emitted:
SCHED 0ms: gomaxprocs=1 idleprocs=0 threads=2 spinningthreads=0 idlethreads=0
runqueue=0 [1]
SCHED 1009ms: gomaxprocs=1 idleprocs=0 threads=3 spinningthreads=0 idlethreads=1
runqueue=0 [9]
runqueue=0 [1]
SCHED 1009ms: gomaxprocs=1 idleprocs=0 threads=3 spinningthreads=0 idlethreads=1
runqueue=0 [9]
Let’s break down what each field represents and then understand the values based on the sample program:
1009ms : Time in milliseconds since the program started.
This is the trace for the 1 second mark.
gomaxprocs=1 : Number of processors configured.
Only one processor is configured for this program.
Think of a processor in this context as a logical processor and not a physical processor. The scheduler
runs goroutines on these logical processors which are bound to a physical processor via the operating
system thread that is attached. The operating system will schedule the thread against any physical
processor that is available.
threads=3 : Number of threads that the runtime is managing.
Three threads exist. One for the processor and 2 others
used by the runtime.
idlethreads=1 : Number of threads that are not busy.
1 thread idle (2 threads running).
idleprocs=0 : Number of processors that are not busy.
0 processors are idle (1 processor is busy).
runqueue=0 : Number of goroutines in the global run queue.
All runnable goroutines have been moved to a local run queue.
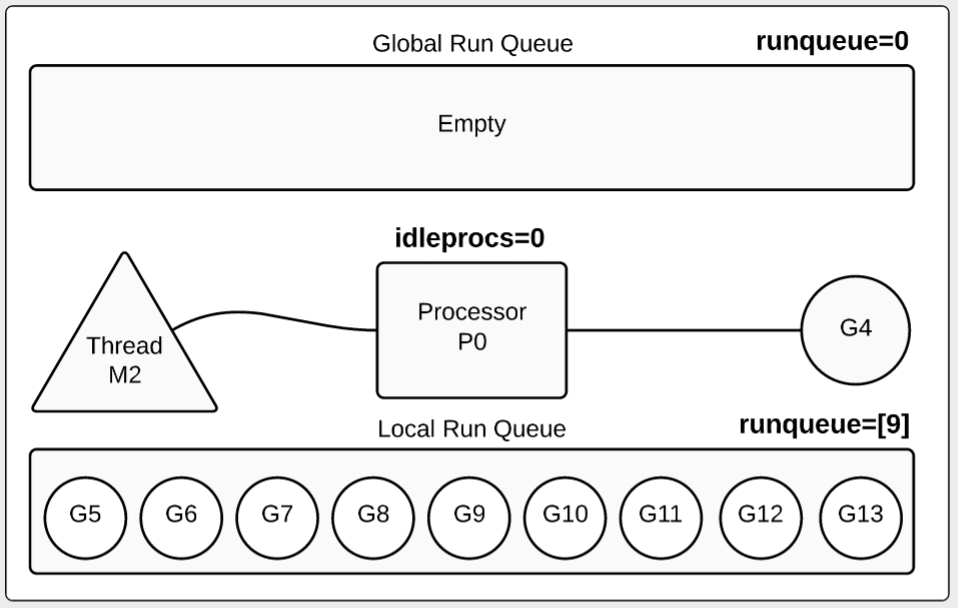
[9] : Number of goroutines in the local run queue.
9 goroutines are waiting inside the local run queue.
The runtime is giving us a lot of great information at the summary level. When we look at the information for the trace at the 1 second mark, we can see how one goroutine is running and the other nine goroutines are waiting inside the local run queue.
Diagram 1
How does the trace change when we have more than one processor configured? Let’s run the program again adding GOMAXPROCS and look at the output traces that change:
GOMAXPROCS=2 GODEBUG=schedtrace=1000 ./example
SCHED 0ms: gomaxprocs=2 idleprocs=1 threads=2 spinningthreads=0
idlethreads=0 runqueue=0 [0 0]
SCHED 1002ms: gomaxprocs=2 idleprocs=0 threads=4 spinningthreads=1
idlethreads=1 runqueue=0 [0 4]
SCHED 2006ms: gomaxprocs=2 idleprocs=0 threads=4 spinningthreads=0
idlethreads=1 runqueue=0 [4 4]
...
SCHED 6024ms: gomaxprocs=2 idleprocs=0 threads=4 spinningthreads=0
idlethreads=1 runqueue=2 [3 3]
...
SCHED 10049ms: gomaxprocs=2 idleprocs=0 threads=4 spinningthreads=0
idlethreads=1 runqueue=4 [2 2]
...
SCHED 13067ms: gomaxprocs=2 idleprocs=0 threads=4 spinningthreads=0
idlethreads=1 runqueue=6 [1 1]
...
SCHED 17084ms: gomaxprocs=2 idleprocs=0 threads=4 spinningthreads=0
idlethreads=1 runqueue=8 [0 0]
...
SCHED 21100ms: gomaxprocs=2 idleprocs=2 threads=4 spinningthreads=0
idlethreads=2 runqueue=0 [0 0]
Let’s focus on the trace for the 2 second mark when we run with two processors:
SCHED 2002ms: gomaxprocs=2 idleprocs=0 threads=4 spinningthreads=0
idlethreads=1 runqueue=0 [4 4]
2002ms : This is the trace for the 2 second mark.
gomaxprocs=2 : 2 processors are configured for this program.
threads=4 : 4 threads exist. 2 for processors and 2 for the runtime.
idlethreads=1 : 1 idle thread (3 threads running).
idleprocs=0 : 0 processors are idle (2 processors busy).
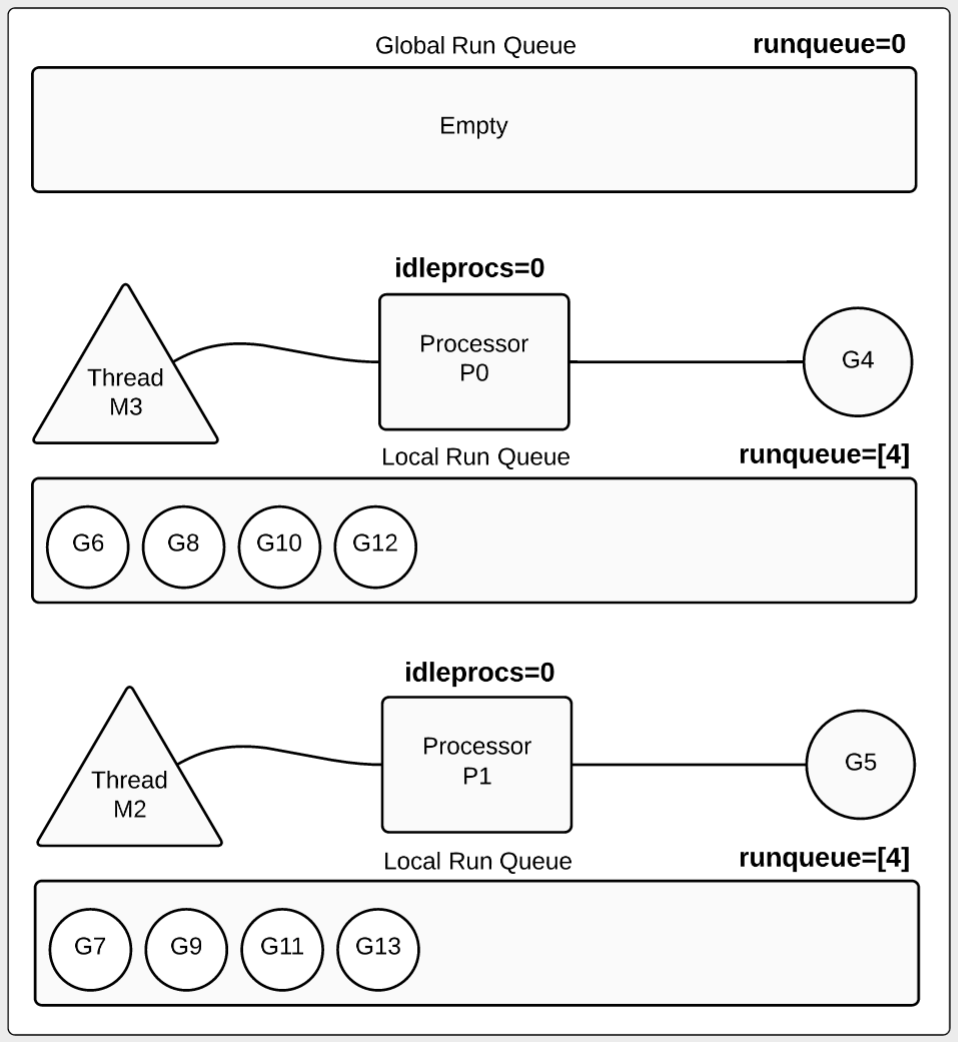
runqueue=0 : All runnable goroutines have been moved to a local run queue.
[4 4] : 4 goroutines are waiting inside each local run queue.
idlethreads=1 runqueue=0 [4 4]
2002ms : This is the trace for the 2 second mark.
gomaxprocs=2 : 2 processors are configured for this program.
threads=4 : 4 threads exist. 2 for processors and 2 for the runtime.
idlethreads=1 : 1 idle thread (3 threads running).
idleprocs=0 : 0 processors are idle (2 processors busy).
runqueue=0 : All runnable goroutines have been moved to a local run queue.
[4 4] : 4 goroutines are waiting inside each local run queue.
Diagram 2
Things change when we get to the 6 second mark:
SCHED 6024ms: gomaxprocs=2 idleprocs=0 threads=4 spinningthreads=0
idlethreads=1 runqueue=2 [3 3]
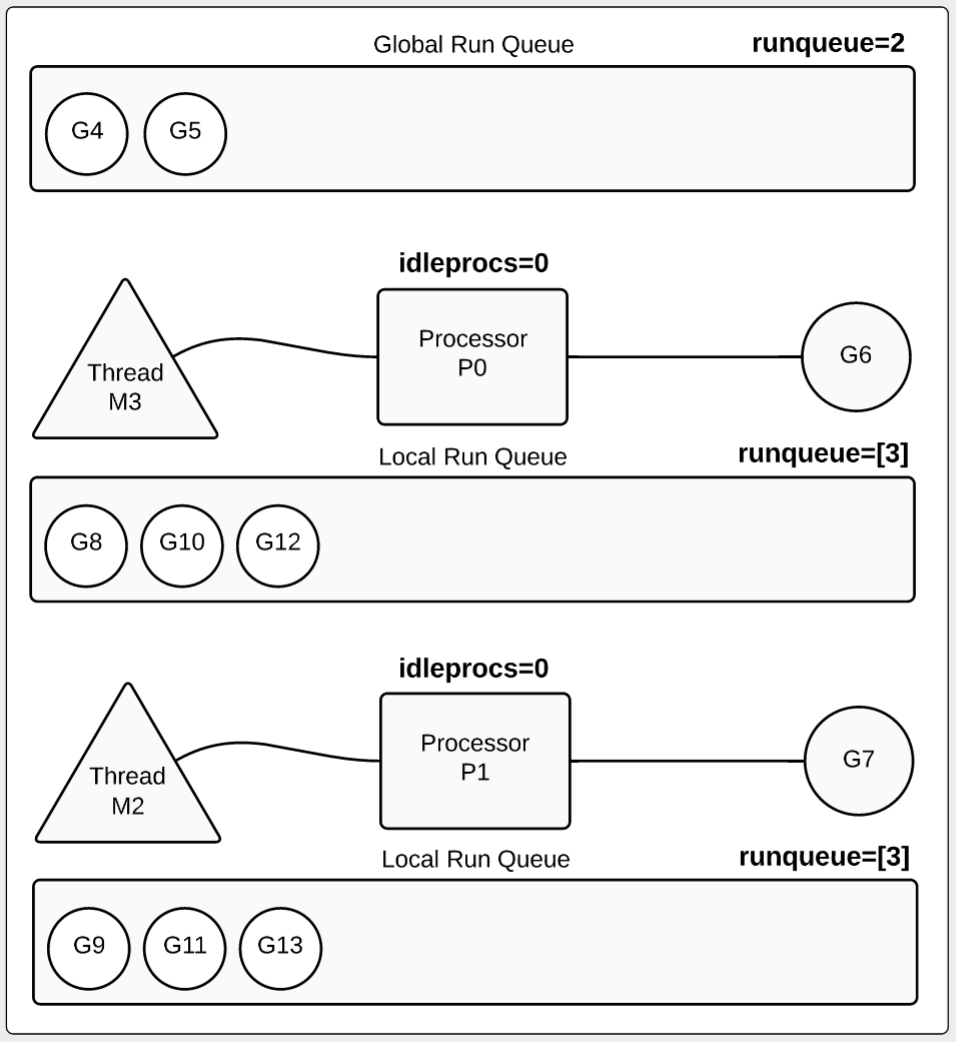
idleprocs=0 : 0 processors are idle (2 processors busy).
runqueue=2 : 2 goroutines returned and are waiting to be terminated.
[3 3] : 3 goroutines are waiting inside each local run queue.
idlethreads=1 runqueue=2 [3 3]
idleprocs=0 : 0 processors are idle (2 processors busy).
runqueue=2 : 2 goroutines returned and are waiting to be terminated.
[3 3] : 3 goroutines are waiting inside each local run queue.
Diagram 3
Advanced Note:
In many cases, goroutines are not moved back to the global run queue prior to being terminated. This program has created a special situation because the for loop is performing logic that runs for more than 10ms and is not calling into any functions. 10ms is the scheduling quant in the scheduler. After 10ms of execution, the scheduler tries to preempt goroutines. These goroutines can’t be preempted because they do not call into any functions. In this case, once the goroutines reach the wg.Done call, the goroutines are instantly preempted and moved to the global run queue for termination.
When the 17 second mark hits, we see the last two goroutines are now running:
SCHED 17084ms: gomaxprocs=2 idleprocs=0 threads=4 spinningthreads=0
idlethreads=1 runqueue=8 [0 0]
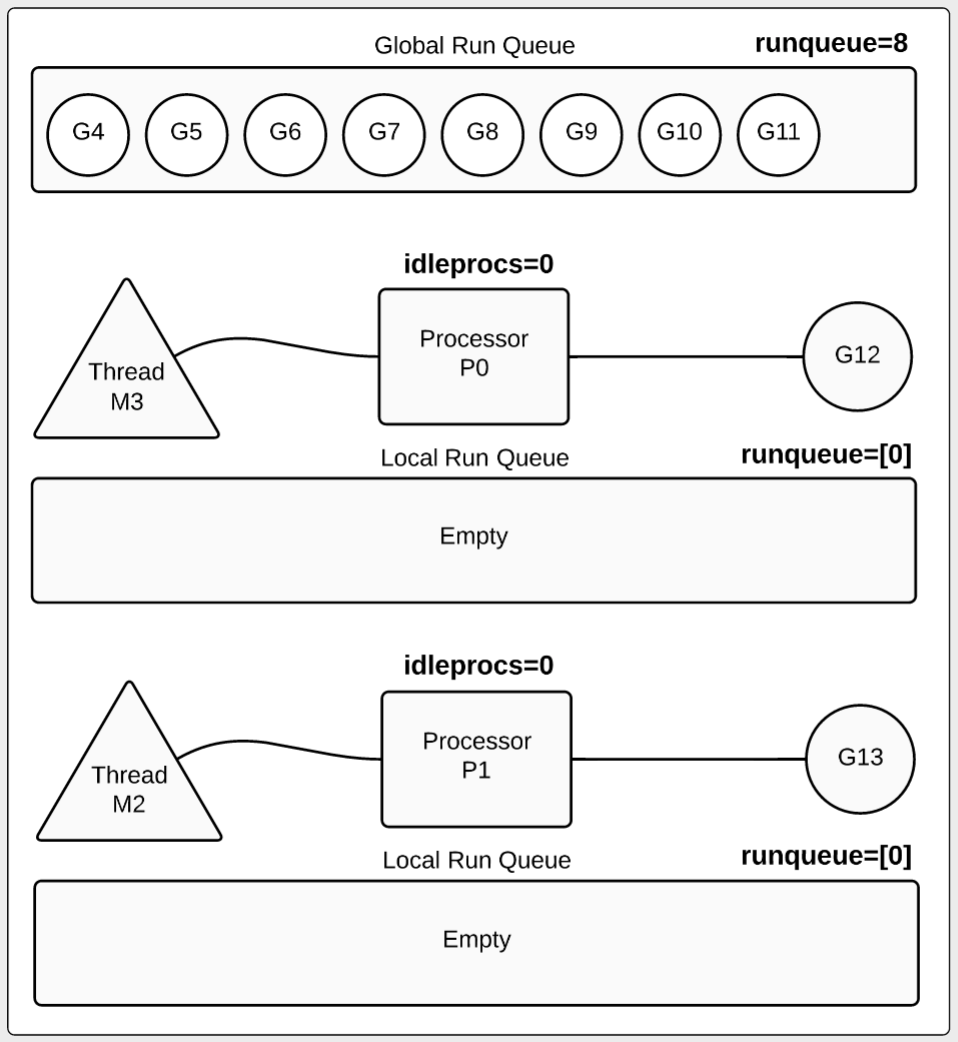
idleprocs=0 : 0 processors are idle (2 processors busy).
runqueue=8 : 8 goroutines returned and are waiting to be terminated.
[0 0] : No goroutines are waiting inside any local run queue.
idlethreads=1 runqueue=8 [0 0]
idleprocs=0 : 0 processors are idle (2 processors busy).
runqueue=8 : 8 goroutines returned and are waiting to be terminated.
[0 0] : No goroutines are waiting inside any local run queue.
Diagram 4
The final trace is at the 21 second mark:
SCHED 21100ms: gomaxprocs=2 idleprocs=2 threads=4 spinningthreads=0
idlethreads=2 runqueue=0 [0 0]
idleprocs=2 : 2 processors are idle (0 processors busy).
runqueue=0 : All the goroutines that were in the queue have been terminated.
[0 0] : No goroutines are waiting inside any local run queue.
idlethreads=2 runqueue=0 [0 0]
idleprocs=2 : 2 processors are idle (0 processors busy).
runqueue=0 : All the goroutines that were in the queue have been terminated.
[0 0] : No goroutines are waiting inside any local run queue.
Diagram 5
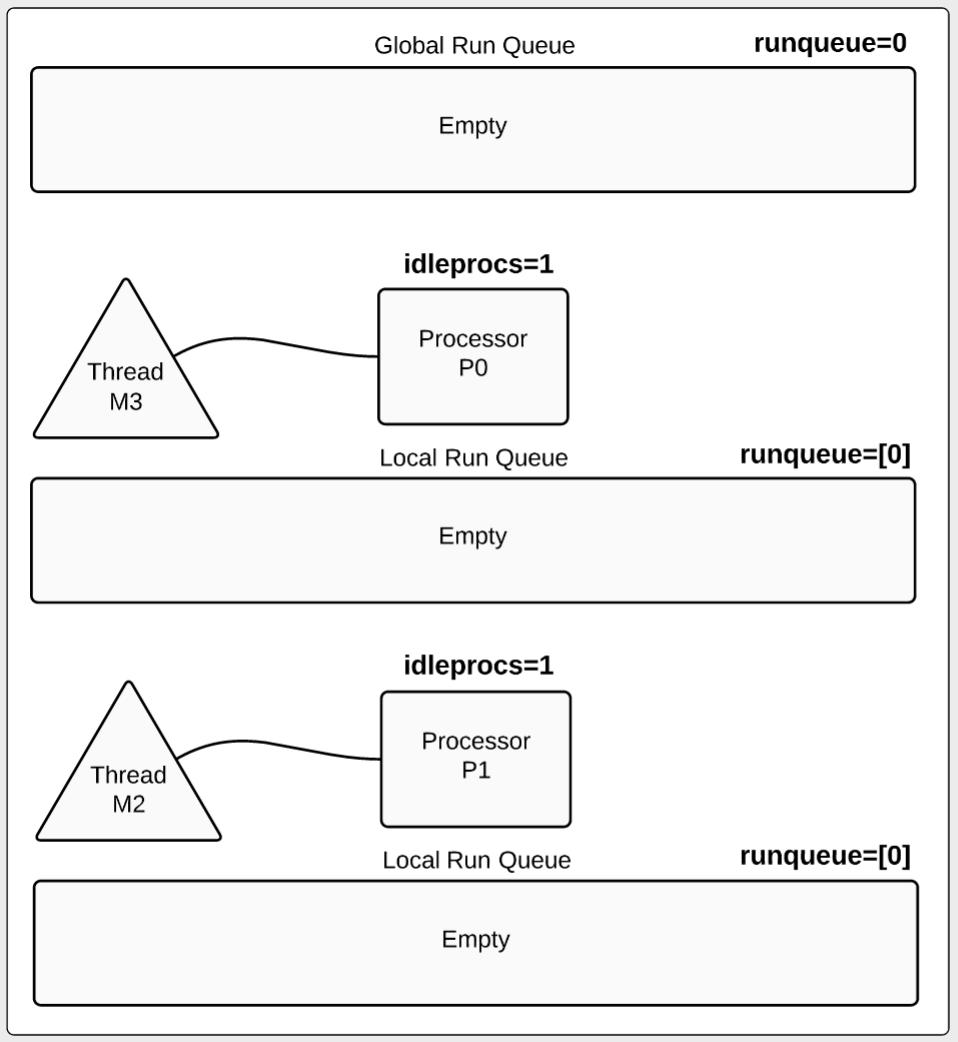
Detailed Scheduler Trace
The scheduler summary information is very helpful, but sometimes you need an even deeper view. In those cases, we can add the scheddetail option which will provide detailed trace information about each processor, thread and goroutine. Let’s run the program again, setting the GODEBUG option to emit detailed trace information:
GOMAXPROCS=2 GODEBUG=schedtrace=1000,scheddetail=1 ./example
Here is the output at the 4 second mark:
SCHED 4028ms: gomaxprocs=2 idleprocs=0 threads=4 spinningthreads=0
idlethreads=1 runqueue=2 gcwaiting=0 nmidlelocked=0 stopwait=0 sysmonwait=0
P0: status=1 schedtick=10 syscalltick=0 m=3 runqsize=3 gfreecnt=0
P1: status=1 schedtick=10 syscalltick=1 m=2 runqsize=3 gfreecnt=0
M3: p=0 curg=4 mallocing=0 throwing=0 gcing=0 locks=0 dying=0 helpgc=0 spinning=0 blocked=0 lockedg=-1
M2: p=1 curg=10 mallocing=0 throwing=0 gcing=0 locks=0 dying=0 helpgc=0 spinning=0 blocked=0 lockedg=-1
M1: p=-1 curg=-1 mallocing=0 throwing=0 gcing=0 locks=1 dying=0 helpgc=0 spinning=0 blocked=0 lockedg=-1
M0: p=-1 curg=-1 mallocing=0 throwing=0 gcing=0 locks=0 dying=0 helpgc=0 spinning=0 blocked=0 lockedg=-1
G1: status=4(semacquire) m=-1 lockedm=-1
G2: status=4(force gc (idle)) m=-1 lockedm=-1
G3: status=4(GC sweep wait) m=-1 lockedm=-1
G4: status=2(sleep) m=3 lockedm=-1
G5: status=1(sleep) m=-1 lockedm=-1
G6: status=1(stack growth) m=-1 lockedm=-1
G7: status=1(sleep) m=-1 lockedm=-1
G8: status=1(sleep) m=-1 lockedm=-1
G9: status=1(stack growth) m=-1 lockedm=-1
G10: status=2(sleep) m=2 lockedm=-1
G11: status=1(sleep) m=-1 lockedm=-1
G12: status=1(sleep) m=-1 lockedm=-1
G13: status=1(sleep) m=-1 lockedm=-1
G17: status=4(timer goroutine (idle)) m=-1 lockedm=-1
The summary section is similar but now we have detailed lines for the processors, threads and goroutines. Let’s start with the processors:
P0: status=1 schedtick=10 syscalltick=0 m=3 runqsize=3 gfreecnt=0
P1: status=1 schedtick=10 syscalltick=1 m=2 runqsize=3 gfreecnt=0
P1: status=1 schedtick=10 syscalltick=1 m=2 runqsize=3 gfreecnt=0
P’s represents a processor. Since GOMAXPROCS is set to 2, we see two P’s listed in the trace. Next, let’s look at the threads:
M3: p=0 curg=4 mallocing=0 throwing=0 gcing=0 locks=0 dying=0 helpgc=0
spinning=0 blocked=0 lockedg=-1
M2: p=1 curg=10 mallocing=0 throwing=0 gcing=0 locks=0 dying=0 helpgc=0
spinning=0 blocked=0 lockedg=-1
M1: p=-1 curg=-1 mallocing=0 throwing=0 gcing=0 locks=1 dying=0 helpgc=0
spinning=0 blocked=0 lockedg=-1
M0: p=-1 curg=-1 mallocing=0 throwing=0 gcing=0 locks=0 dying=0 helpgc=0
spinning=0 blocked=0 lockedg=-1
spinning=0 blocked=0 lockedg=-1
M2: p=1 curg=10 mallocing=0 throwing=0 gcing=0 locks=0 dying=0 helpgc=0
spinning=0 blocked=0 lockedg=-1
M1: p=-1 curg=-1 mallocing=0 throwing=0 gcing=0 locks=1 dying=0 helpgc=0
spinning=0 blocked=0 lockedg=-1
M0: p=-1 curg=-1 mallocing=0 throwing=0 gcing=0 locks=0 dying=0 helpgc=0
spinning=0 blocked=0 lockedg=-1
M’s represents a thread. Since the threads value is set to 4 in the summary trace, we see four M’s listed in the detail. The detailed trace information shows which threads belong to which processors:
P0: status=1 schedtick=10 syscalltick=0 m=3 runqsize=3 gfreecnt=0
M3: p=0 curg=4 mallocing=0 throwing=0 gcing=0 locks=0 dying=0 helpgc=0
spinning=0 blocked=0 lockedg=-1
M3: p=0 curg=4 mallocing=0 throwing=0 gcing=0 locks=0 dying=0 helpgc=0
spinning=0 blocked=0 lockedg=-1
Here we see how thread M3 is attached to processor P0. This information is in both the P and M trace records.
A G represents a goroutine. At the 4 second mark we see that there are fourteen goroutines that currently exist and seventeen goroutines have been created since the program started. We know the total number of goroutines created because of the number attached to the last G listed in the trace:
G17: status=4(timer goroutine (idle)) m=-1 lockedm=-1
If this program continued to create goroutines, we would see this number increase linearly. If this program was handling web requests for example, we could use this number to get a general idea of the number of requests that have been handled. This estimate would only be close if the program didn’t create any other goroutines during the handling of the request.
Next, let’s look at the goroutine the main function is running against:
G1: status=4(semacquire) m=-1 lockedm=-1
30 wg.Done()
30 wg.Done()
We can see that the goroutine for the main function is in a status of 4, blocked on a semacquire which represents the wait group Wait call.
To better understand the rest of the goroutines in this trace, it is helpful to know what the status numbers represent. Here is a list of status codes that are declared in the header file for the runtime:
status: http://golang.org/src/runtime/
Gidle, // 0
Grunnable, // 1 runnable and on a run queue
Grunning, // 2 running
Gsyscall, // 3 performing a syscall
Gwaiting, // 4 waiting for the runtime
Gmoribund_unused, // 5 currently unused, but hardcoded in gdb scripts
Gdead, // 6 goroutine is dead
Genqueue, // 7 only the Gscanenqueue is used
Gcopystack, // 8 in this state when newstack is moving the stack
When we look at the ten goroutines we created, we can now look at their state and better understand what each is doing:
// Goroutines running in a processor. (idleprocs=0)
G4: status=2(sleep) m=3 lockedm=-1 -- Thread M3 / Processor P0
G10: status=2(sleep) m=2 lockedm=-1 -- Thread M2 / Processor P1
// Goroutines waiting to be run on a particular processor. (runqsize=3)
G5: status=1(sleep) m=-1 lockedm=-1
G7: status=1(sleep) m=-1 lockedm=-1
G8: status=1(sleep) m=-1 lockedm=-1
// Goroutines waiting to be run on a particular processor. (runqsize=3)
G11: status=1(sleep) m=-1 lockedm=-1
G12: status=1(sleep) m=-1 lockedm=-1
G13: status=1(sleep) m=-1 lockedm=-1
// Goroutines waiting on the global run queue. (runqueue=2)
G6: status=1(stack growth) m=-1 lockedm=-1
G9: status=1(stack growth) m=-1 lockedm=-1
With a basic understanding of the scheduler and knowing the behavior of our program, we can get a detailed view of how things are being scheduled and the state of each processor, thread and goroutine in our program.
Conclusion:
The GODEBUG variable is a great way to peek into the mind of the scheduler while your program runs. It can tell you a lot about how your program is behaving. If you want to learn more, start by writing some simple programs that you can use to predict the traces coming from the scheduler. Learn what to expect before trying to look at a trace for more complicated programs.